


By David Freddoso, Online Opinion Editor, Washington Examiner
Robert F. Kennedy Jr., who flies around on private planes so as to tell larger numbers of people how they must live their lives in order to save the planet, wrote a column last year on the lack of winter weather in Washington, D.C.
In Virginia, the weather also has changed dramatically. Recently arrived residents in the northern suburbs, accustomed to today’s anemic winters, might find it astonishing to learn that there were once ski runs on Ballantrae Hill in McLean, with a rope tow and local ski club. Snow is so scarce today that most Virginia children probably don’t own a sled. But neighbors came to our home at Hickory Hill nearly every winter weekend to ride saucers and Flexible Flyers.
In those days, I recall my uncle, President Kennedy, standing erect as he rode a toboggan in his top coat, never faltering until he slid into the boxwood at the bottom of the hill. Once, my father, Atty. Gen. Robert Kennedy, brought a delegation of visiting Eskimos home from the Justice Department for lunch at our house. They spent the afternoon building a great igloo in the deep snow in our backyard. My brothers and sisters played in the structure for several weeks before it began to melt. On weekend afternoons, we commonly joined hundreds of Georgetown residents for ice skating on Washington’s C&O Canal, which these days rarely freezes enough to safely skate.
Meanwhile, Exxon Mobil and its carbon cronies continue to pour money into think tanks whose purpose is to deceive the American public into believing that global warming is a fantasy.
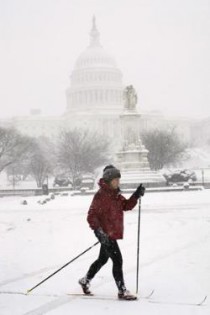
Having shoveled my walk five times in the midst of this past weekend’s extreme cold and blizzard, I think perhaps RFK, Jr. should leave weather analysis to the meteorologists instead of trying to attribute every global phenomenon to anthropogenic climate change.
By Shanta Barley, New Scientist
A rise in water vapour in the atmosphere fuelled 30 per cent of the global warming that took place during the 1990s. This discovery suggests that the potent greenhouse gas plays a bigger role in climate change that we previously imagined.
Susan Solomon and colleagues at the US National Oceanic and Atmospheric Administration combined satellite measurements and weather balloon data to track changes in the concentration of water vapour 16 kilometres up in the stratosphere, between the 1980s and today.
Water vapour levels in the stratosphere increased in the 1990s but dropped by 10 per cent in 2001. After feeding their measurements into a climate model, the team suggests that vapour was to blame for almost a third of the warming that happened in the 1990s.
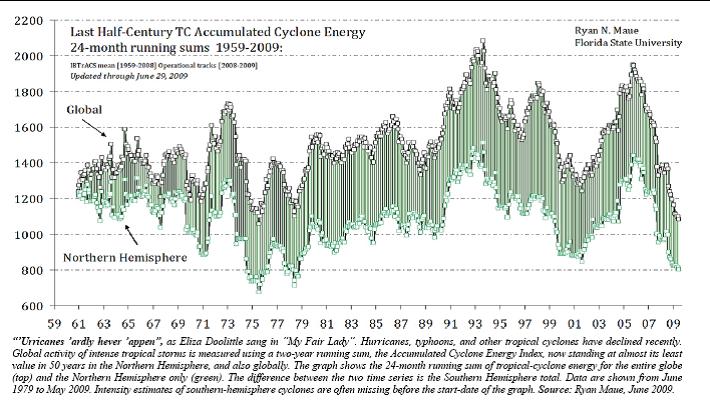
Icecap Note: that corresponded to a decline in tropical activity during the cold PDO La Ninas of 1999 to 2001 (below, enlarged here).
It likely bounced back and then declined agin afte the 2005 tropical activity spike
The model also suggests that the decline in water vapour concentrations that occurred in 2001 slowed down the rate of global warming in the last decade by 25 per cent.
“This research does not change the consensus view that human emissions drive climate change,” says Fortunat Joos, a climate modeller at the University of Bern, Germany.
Journal reference: Science DOI: 10.1126/science.1182488
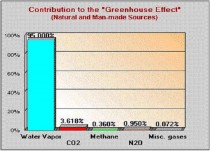
Water vapor is 20 times more abundant greenhouse gas than CO2, a bit player at best in climate change, but of course you can’t tax or control the hydrological cycle
-------------------------
Is the NULL default infinite hot?
By E.M. Smith
What to make of THIS bizarre anomaly map?
What Have I Done?
I was exploring another example of The Bolivia Effect where an empty area became quite “hot” when the data were missing (Panama, posting soon) and that led to another couple of changed baselines that led to more ‘interesting red’ (1980 vs 1951-1980 baseline). I’m doing these examinations with a 250 km ‘spread’ as that tells me more about where the thermometers are located. The above graph, if done instead with a 1200 km spread or smoothing, has the white spread out to sea 1200 km with smaller infinite red blobs in the middles of the oceans.
I thought it would be ‘interesting’ to step through parts of the baseline bit by bit to find out where it was “hot” and “cold”. (Thinking of breaking it into decades… still to be tried...) When I thought:
Well, you always need a baseline benchmark, even if you are ‘benchmarking the baseline’, so why not start with the “NULL” case of baseline equal to report period? It ought to be a simple all white land area with grey oceans for missing data.
Well, I was “A bit surprised” when I got a blood red ocean everywhere on the planet.
You can try it yourself at the NASA / GISS web site map making page.
In all fairness, the land does stay white (no anomaly against itself) and that’s a very good thing. But that Ocean!
ALL the ocean area with no data goes blood red and the scale shows it to be up to 9999 degrees C of anomaly.
“Houston, I think you have a problem”.
Why Don’t I Look In The Code?
Well, the code NASA GISS publishes and says is what they run, is not this code that they are running.
Yes, they are not publishing the real code. In the real code running on the GISS web page to make these anomaly maps, you can change the baseline and you can change the “spread” of each cell. (Thus the web page that lets you make these “what if” anomaly maps). In the code they publish, the “reach” of that spread is hard coded at 1200 km and the baseline period is hard coded at 1951-1980.
So I simply can not do any debugging on this issue, because the code that produces these maps is not available.
But what I can say is pretty simple:
If a map with no areas of unusual warmth (by definition with the baseline = report period) has this happen; something is wrong.
I’d further speculate that that something could easily be what causes The Bolivia Effect where areas that are lacking in current data get rosy red blobs. Just done on a spectacular scale.
Further, I’d speculate that this might go a long way toward explaining the perpetual bright red in the Arctic (where there are no thermometers so no thermometer data). This “anomaly map” includes the HadCRUT SST anomaly map for ocean temperatures. The striking thing about this one is that those two bands of red at each pole sure look a lot like the ‘persistent polar warming’ we’ve been told to be so worried about. One can only wonder if there is some “bleed through” of these hypothetical warm spots when the ‘null data’ cells are averaged in with the ‘real data cells’ when making non-edge case maps. But without the code, it can only be a wonder:
With 250 km ‘spread’ and HadCRUT SST anomalies we get bright red poles.
The default 1200 km present date map for comparison:
GIS Anomaly Map for November 2009
I’m surprised nobody ever tried this particular ‘limit case’ before. Then again, experienced software developers know to test the ‘limit cases’ even if they do seem bizarre, since that’s where the most bugs live. And this sure looks like a bug to me.
A very hot bug… Read more here.
Read also the Madagascar Muse here which shows despite no stations, a permanent red spot appeared over Madagascar in recent years thanks to the interpolation made. In the latest update after the post, GISS removed that hotspot.
See Surface temperature Records: Policy Driven Deception? which heavily drew on data from E.M. Smith and postings by Anthony Watts here.
----------------------
UAH MSU jumped this month with a boost from ocean temperature rises. This has been jumped on by alarmsists trying to deflect attention from the brutal Northern Hemisphere land winter. Why the satellite sensed ocean warming? Walter Starck explains:
“Sea surface temperatures in the top meter of the oceans rapidly increase in periods of extended calm weather due to the cessation of wave driven mixing. After a week or two of calm, the surface temperature may become as much as 4-5 degrees higher than the temperature 2m below the surface. This thermal stratification disappears in a few hours when normal trade winds resume. El Niño events are characterized by extended and expanded areas of calm over the tropical oceans and it is this calm, not exceptional atmospheric temperatures, which is responsible for the rise in sea surface temperatures.
Elevated sea surface temperatures would presumably result in greater transfer of thermal energy to the atmosphere via increased back radiation, conduction/convection and evaporation. After an El Nino, when the warm layer is again mixed through the normal 70-100m thickness of the surface zone above the thermocline, the total thermal content should be somewhat less than it otherwise would be due to the cessation of mixing during the period of calm and the greater loss to the atmosphere from the higher temperature shallow surface layer. The result is that the high SSTs characteristic of El Ninos is followed by a period of lower than average surface temperatures (i.e. La Nina). This seems quite evident following the 1998 El Nino.
I am aware of the high temperature shallow surface layer from a lifetime of diving in the tropics where I have experienced it directly on repeated occasions. Although this warm surface layer would show up in old fashioned measurements taken using buckets it would not appear in temperatures taken from cooling water intakes on ships since they are below it and XBT records would be problematic as the heated layer is so limited in thickness.
I suspect that the high January SSTs just experienced are a manifestation of this effect and will be followed by lower than average SSTs when normal trade winds resume. The important thing that is not being properly recognized is that the higher SSTs of El Nino events involves only a very shallow surface layer, not the entire upper mixed layer of the ocean.”
By Richard North
Less than a week after he claimed the IPCC’s credibility had increased as a result of its handling of the “Glaciergate” scandal, Pachauri’s own personal credibility lies in tatters as The Times accuses him of a direct lie.
This is about when he first became aware of the false claim over the melting glaciers, Pachauri’s version on 22 January being that he had only known about it “for a few days” - i.e., after it had appeared in The Sunday Times.
However, Ben Webster writes that a prominent science journalist, Pallava Bagla - who works for the Science journal (and NDTV as its science correspondent) - claims that last November he had informed Pachauri that Graham Cogley, a professor at Ontario Trent University and a leading glaciologist, had dismissed the 2035 date as being wrong by at least 300 years. Pachauri had replied: “I don’t have anything to add on glaciers.”
Bagla interviewed Dr Pachauri again this week and asked him why he had decided to overlook the error before the Copenhagen summit. In the taped interview, he asked: “I pointed it out [the error] to you in several e-mails, several discussions, yet you decided to overlook it. Was that so that you did not want to destabilise what was happening in Copenhagen?”
Dr Pachauri replied: “Not at all, not at all. As it happens, we were all terribly preoccupied with a lot of events. We were working round the clock with several things that had to be done in Copenhagen. It was only when the story broke, I think in December, we decided to, well, early this month - as a matter of fact, I can give you the exact dates - early in January that we decided to go into it and we moved very fast.”
According to Pachauri, “… within three or four days, we were able to come up with a clear and a very honest and objective assessment of what had happened. So I think this presumption on your part or on the part of any others is totally wrong. We are certainly never - and I can say this categorically - ever going to do anything other than what is truthful and what upholds the veracity of science.”
Without even Bagla’s input, we know this to be lies. Apart from anything else, there was the crisis meeting under the aegis of UNEP - which we reported on Thursday - which concluded that the 2035 claim “does not appear to be based upon any scientific studies and therefore has no foundation”.
Separately, we have Syed Hasnain, while stressing that he was not involved in drafting the IPCC report, claiming that he noticed some of the mistakes when he first read the relevant section in 2008.
That was also the year he joined TERI in Delhi, headed by Dr Pachauri. Then, he says, he realised that the 2035 prediction was based on an interview he gave to the New Scientist magazine in 1999. But, he claims, he did not tell Pachauri because he was not working for the IPCC and was busy with his own programmes.
“I was keeping quiet as I was working here,” he said. “My job is not to point out mistakes. And you know the might of the IPCC. What about all the other glaciologists around the world who did not speak out?”
However, Hasnain’s assertions contrast rather sharply with a video interview given by him to NDTV (see clip above) on 9 November 2009 - the day that the Raina report on glaciers was published, challenging the claims made in the IPCC report. Then, he is seen to be defending the 2035 figure, and allowing himself to be styled as “author of the original IPCC report”.
According to The Guardian, V K Raina, formerly deputy director general of the Geological Survey of India, has joined calls for Pachauri’s resignation.
The Guardian cites India’s Economic Times from over a week ago, which criticised the IPCC for damaging its own credibility, noting that “it would now seem that Mr Pachauri’s steadfast unwillingness to consider an alternate position could well have given climate sceptics a stronger footing.”
But today, the Deccan Herald also weighs in, declaring: “The [glacier] incident reflects poorly on the professionalism and scientific rigour of the IPCC and has done damage to its credibility.” The writing is not so much on the wall as obliterating it.
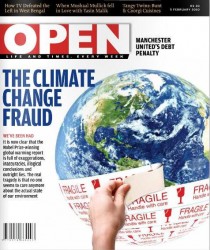
Adding to the graffiti, in yet another development, the popular Indian magazine Open rips apart global warming, labelling it: “The Hottest Hoax in the World.” Indian blogger Gurmeet in Liberty News Central thinks this could be the most hard-hitting article in the Indian MSM on AGW fraud ever.
Given what is about to descend upon him on Sunday, by the time the Indian media have absorbed the detail, Pachauri will be history. See Richard North’s blog here.
-------------------------
Global Warming: the Collapse of a Grand Narrative
By Philip Stott, The Clamour of the Times, Saturday, 30 January 2010
For over a month now, since the farcical conclusion of the Copenhagen Climate Change Conference, I have been silent, partly through family commitments abroad in the USA, but also because, in this noisy world, in ‘The Clamour Of The Times’, it is on occasion better to be quiet and contemplative, to observe rather than to comment. And, as an independent academic, it has been fascinating to witness the classical collapse of a Grand Narrative, in which social and philosophical theories are being played out before our gaze. It is like watching the Berlin Wall [pictured] being torn down, concrete slab by concrete slab, brick by brick, with cracks appearing and widening daily on every face - political, economic, and scientific. Likewise, the bloggers have been swift to cover the crumbling edifice with colourful graffiti, sometimes bitter, at others caustic and witty.

The Political And Economic Collapse
Moreover, the collapse has been quicker than any might have predicted. The humiliating exclusion of Britain and the EU at the end of the Copenhagen debacle was partially to be expected, but it was brutal in its final execution. The swing of power to the BASIC group of countries (Brazil, South Africa, India, China) had likewise been signified for some time, but, again, it came with precipitate ease, leaving even the American President, Barack Obama, with no doubts as to where the political agenda on climate change was now heading, namely to the developing world, but especially to the East, and to the Pacific Rim. The dirigiste tropes of ‘Old Europe’, with its love of meaningless targets and carbon capping, will no longer carry weight, while Obama himself has been straitjacketed by the voters of Massachusetts, by the rust-belt Democrats, by a truculent Congress, by an increasingly-sceptical and disillusioned American public, but, above all, by the financial crisis. Nothing will now be effected that for a single moment curbs economic development, from China to Connecticut, from Africa to Alaska.
And, as ever, capitalism has read the runes, with carbon-trading posts quietly being shed, ‘Green’ jobs sidelined, and even big insurance companies starting to hedge their own bets against the future of the Global Warming Grand Narrative. These rats are leaving the sinking ship far faster than any politician, many of whom are going to be abandoned, left, still clinging to the masts, as the Good Ship ‘Global Warming’ founders on titanic icebergs in the raging oceans of doubt and delusion.
The Scientific Collapse
And what can one say about ‘the science’? ‘The ‘science’ is already paying dearly for its abuse of freedom of information, for unacceptable cronyism, for unwonted arrogance, and for the disgraceful misuse of data at every level, from temperature measurements to glaciers to the Amazon rain forest. What is worse, the usurping of the scientific method, and of justified scientific scepticism, by political policies and political propaganda could well damage science sensu lato - never mind just climate science - in the public eye for decades. The appalling pre-Copenhagen attacks by the British Prime Minister, Gordon Brown, and his climate-change henchman, Ed Miliband, on those who dared to be critical of the science of climate change were some of the most unforgivable I can recall.
It is further salutary that much of the trouble is now emanating from India. Indeed, the nonsense written about the Indian Sub-Continent has been a particular nadir in climate-change science, and it has long been judged so by many experts on the region. My ex-SOAS friend and colleague, Dr. Robert Bradnock, a world authority on the Sub-Continent, has been seething for years over the traducing of data and information relating to this key part of the world. In June, 2008, he wrote:
“However, in my own narrow area of research, I know that many of the claims about the impact of ‘global warming’ in Bangladesh, for example, are completely unfounded. There is no evidence that flooding has increased at all in recent years. Drought and excessive rainfall are the nature of the monsoon system. Agricultural production, far from being decimated by worsening floods over the last twenty years, has nearly doubled. In the early 1990s, Houghton published a map of the purported effects of sea-level rise on Bangladesh. Coming from a Fellow of the Royal Society, former Head of the Met Office and Chair of the IPCC, this was widely accepted, and frequently reproduced. Yet, it shows no understanding of the complex processes that form the Bengal delta, and it is seriously misleading. Moreover, despite the repeated claims of the World Wide Fund, Greenpeace, and, sadly, Christian Aid, the melting of the Himalayan glaciers is of completely marginal significance to the farmers of the plains in China, India, Bangladesh, and Pakistan. One could go on!”
The Media Collapse
One could indeed! But we may not need to do so for much longer. Why? Because the biggest collapse is in the media, the very ‘mechanism’ through which the greedy Global Warming Grand Narrative has promulgated itself during the last ten to twenty years. The break in the ‘Media Wall’ began in the tabloids and in the ‘red tops’, like The Daily Express and the Daily Mail and Mail on Sunday, but it is today spreading rapidly - yet once more as theory predicts - to the so-called ‘heavyweights’ and to the BBC. In the past, uncritical and apocalyptic stories and programmes were given the highest prominence, with any sceptical comment confined to the briefest of quotations from some benighted, and often snidely-mentioned, sceptic squeezed in at the very end of the piece ("For balance, you know"). Today, the reverse is becoming true, with the ‘global warming’ faithful firmly forced on to the back foot. Yet, in our post-modern world, it is the journalistic language being employed that is the true indicator of a new media order. Listening to good old Roger Harrabin this morning, reporting on BBC Radio 4’s flagship ‘Today’ programme, was a revelation in this respect; the language, and even the style, had altered radically.
Potential Losers
The collapse is now so precipitate that there will inevitably be some serious losers caught out by it all. The UK Met Office could well be one, with the BBC rightly reviewing its contract with them. At the moment, Met Office spokespersons sound extraordinary, bizarre even. They bleat out ‘global warming’ phrases like programmed robotic sheep, although they are finding it increasingly difficult to pull the wool over our eyes. It is terribly 1984, and rather chilling, so to speak. It is obvious that the organisation is suffering from another classical academic state, namely that known as ‘cognitive dissonance’ [see here and here]. This is experienced when belief in a Grand Narrative persists blindly, even when the facts in the real world begin to contradict what the narrative is saying. Sadly, many of our public and private organisations have allowed themselves to develop far too great a vested interest in ‘global warming’, as have too many politicians and activists. These are increasingly terrified, many having no idea how to react, or how to adjust, to the collapse. It will be particularly interesting to witness how, in the end, the Royal Society plays its cards, especially if competing scientific paradigms, such as the key role played by water vapour in climate change, start to displace the current paradigm in classic key role played by water vapour in climate change, start to displace the current paradigm in classic fashion. Icecap Note: This may be Susan Solomon’s bout with cognitive dissonance.
“For over a month now, since the farcical conclusion of the Copenhagen Climate Change Conference, I have been silent, partly through family commitments abroad in the USA, but also because, in this noisy world, in ‘The Clamour Of The Times’, it is on occasion better to be quiet and contemplative, to observe rather than to comment. And, as an independent academic, it has been fascinating to witness the classical collapse of a Grand Narrative, in which social and philosophical theories are being played out before our gaze. It is like watching the Berlin Wall [pictured] being torn down, concrete slab by concrete slab, brick by brick, with cracks appearing and widening daily on every face - political, economic, and scientific. Likewise, the bloggers have been swift to cover the crumbling edifice with colourful graffiti, sometimes bitter, at others caustic and witty.
Certain newspapers, like my own DNOC, The Times, have also been a tad slow to grasp the magnitude of the collapse (although Ben Webster has tried valiantly to counter this with some good pieces); yet, even such outlets at last appear to be fathoming the remarkable changes taking place. Today, for example, The Times carries a brief, but seminal, critique of the ‘science’ from Lord Leach of Fairford.
What Will It Mean?
I have long predicted, and in public too, that the Copenhagen Conference could prove to be the beginning of the end for the Global Warming Grand Narrative. It appears that I may well have been right, and, indeed, I may have considerably underestimated the speed, and the dramatic nature, of the demise. Where this all leaves our politicians and political parties in the UK; where it leaves climate science, scientists more generally, and the Royal Society; where it leaves energy policy; where it leaves the ‘Green’ movement; and, where it leaves our media will have to be topics for many later comments and analyses. For the moment, we must not underestimate the magnitude of the collapse. Academically, it is jaw-dropping to observe.
And, the political, economic, and scientific consequences will be profound. See Philip’s site sinfonia here.
See also Dr. Vincent Gray’s view of the Decline of Science here.
Recent revelations from the Climategate emails, originating from the Climatic Research Unit at the University of East Anglia showed how all the data centers, most notably NOAA and NASA, conspired in the manipulation of global temperature records to suggest that temperatures in the 20th century rose faster than, in reality, they actually did.
This has inspired climate researchers worldwide to take a hard look at the data proffered by comparing it to the original data and to other data sources. This report compiles some of the initial alarming findings.
There has clearly been some cyclical warming in recent decades, most notably 1979 to 1998. However, the global surface-station data is seriously compromised. First, there is a major station dropout and increase in missing data in stations that remained which occurred suddenly around 1990; about the time the global warming issue was being elevated to importance in political and environmental circles. A clear bias was found towards removing cooler higher elevation, higher latitude, and rural stations during this culling process though leaving their data in the base periods from which ‘averages’ and anomalies are computed.
The data also suffers contamination by urbanization and other local factors such as land-use/land-cover changes and improper siting. There are uncertainties in ocean temperatures; no small issue, as oceans cover 71% of the earth’s surface.
These factors all lead to significant uncertainty and a tendency for overestimation of century-scale temperature trends. A conclusion from all findings suggest that global data bases are seriously flawed and can no longer be trusted to assess climate trends or rankings or validate model forecasts. And, consequently, such surface data should be ignored for decision making.
This SPPI sponsored working paper by Joe D’Aleo of Icecap and Anthony Watts of Watts Up With That looks at the many issues associated with NOAA and NASA temperature data.
NOAA has already responded to the preliminary paper for John Coleman’s KUSI special through the Yale Climate Forum:
However, as Thomas Peterson and Russell Vose, the researchers who assembled much of GHCN, have explained:
“The reasons why the number of stations in GHCN drop off in recent years are because some of GHCN’s source datasets are retroactive data compilations (e.g., World Weather Records) and other data sources were created or exchanged years ago. Only three data sources are available in near-real time.
It’s common to think of temperature stations as modern Internet-linked operations that instantly report temperature readings to readily accessible databases, but that is not particularly accurate for stations outside of the United States and Western Europe. For many of the world’s stations, observations are still taken and recorded by hand, and assembling and digitizing records from thousands of stations worldwide is burdensome.
During that spike in station counts in the 1970s, those stations were not actively reporting to some central repository. Rather, those records were collected years and decades later through painstaking work by researchers. It is quite likely that, a decade or two from now, the number of stations available for the 1990s and 2000s will exceed the 6,000-station peak reached in the 1970s.”
So rest assured, we can make trillion dollar decisions today based on imperfect, tainted data and correct it in two decades when we painstakingly gather the missing data for the 1990s through 2010s and fix it. Our government at work.
See also SPPI’s December Monthly CO2 Report by Christopher Monckton here.
See this interesting analysis that shows why interpolating large distances to estimate temperatures is fraught with error here. See E.M. Smith’s “Temperatures now compared to maintained GHCN” where he responds to NCDC claims that gathering data is hard here.
-----------------------------------
NASA, NOAA create global warming trend with cooked data
By Kirk Myers, Seminole County Environmental Examiner
The cooks - er, “scientists” - at NASA’s Goddard Institute of Space Studies (GISS) have released their latest sky-is-falling temperature findings, and they show 2009 as the second-warmest year for the planet since modern record-keeping began in 1880, and 2009 temperatures in the Southern Hemisphere the warmest since 1880.
The head chefs at NOAA’s National Climatic Data Center (NCDC), working from a slightly different recipe, reveal a 2009 that was not as well done as NASAs, ranking only the fifth-warmest since 1880.
Other not-so-well-done findings:
NASA cooks:
January 2000 to December 2009 was the warmest decade on record. Surface temperatures have been trending upward 0.38 degrees per decade during the last three decades. In total, average global temperatures have increased by about 1.4 degrees since 1880 ("an important number to keep in mind,” says NASA climatologist Gavin Schmidt.)
NOAA chefs:
Global land and ocean annual surface temperatures for 2009 tied with 2006 as the fifth-warmest on record, at 1.01 degrees about the 20th century average. The 2000 - 2009 decade is the warmest on record, with average global surface temperature of 0.96 degrees above the 20th century average.
Land surface temperatures in 2009 tied with 2003 as the seventh-warmest on record, at 1.39 degrees above the 20th century average. The years 2001- 2008 each rank among the 10 warmest years since 1880.
How do they arrive at the numbers?
There is a major problem with the NASA and NOAA numbers, according to skeptical researchers who have dissected the data: They are inaccurate, the result of cherry-picking, computer manipulation and “best guess” interpretation. The agency kitchens have concocted warming global temperatures using a hard-to-follow recipe of thinning reporting stations, grid-box interpolation, temperature homogenization, and algorithmic ingredients blended into a tweak-on-the-fly computer program.
Veteran meteorologist Joe D’Aleo - a long-time critic of official global-warming statistics - says NASA and NOAA are manipulating the data, calling their actions the U.S. version of last year’s Climategate scandal. The Climategate brouhaha ensued when thousands of hacked (or whistleblower) e-mails were uploaded last November to the Web from Britains Climate Research Unit (CRU) in East Anglia and seen by millions of fascinated snoops. The revealing missives exposed scientific misconduct by top climate scientists and researchers, several of whom are now under investigation in Britain and the United States.
“The CRU has been ground zero for alleged scientific conduct, but other national weather centers, organizations, universities, and the U.S. global data centers at NOAA and NASA are complicit in the misrepresentation or manipulation of data to support the supposed [global warming] consensus,” says D’Aleo, who also heads ICECAP, the International Climate and Environmental Change Assessment Project.
What warming?
NASA and NOAA have several data-manipulation tricks in their global warming cookbook. But before eyeballing their recipe, here are few inconvenient truths that failed to make their way into the NASA and NOAA press releases. According to D’Aleo: “Global temperatures peaked in late 1990s, leveled off, and have been declining since 2001. All five official databases - NOAA’s NCDC, NASA GISS, Hadley CRU, University of Alabama at Birmingham (UAH), and Remote Sensing Systems (RSS) - confirm the decline.”
Satellite data and land-ocean data sets are diverging. Last year, NOAA announced that June global temperatures ranked the second-warmest in 130 years, while the two satellite data sources—UAH and RSS --ranked the month’s temperatures the 15th and 14th coldest, respectively, in 31 years of record-keeping. In 2009, all regions of the United States were normal or below normal except for the Southwest and Florida, according to the NCDC.
The annual temperature in 2008 was the coolest since 1997, according to NOAA. Thirty-seven of 50 states set their all-time record temperatures in the decades prior to 1960.
According to the NCDC, 1936 experienced the hottest overall summer on record in the continental United States. In fact, out of 50 states, 24 recorded their all-time high temperature during the 1930s. The 2000s had the most benign weather, in terms of records (heat and cold), of any decade since the 1880s.
According to the Danish Meteorological Institute, arctic temperatures are currently below minus 31.27 degrees, more than five degrees below normal and the lowest since 2004. Last year, Chicago experienced its coolest July 8 in 118 years, and only four days during the summer reached the 90s. Six states experienced their coldest-ever July in 115 years, four the second coldest and two the third coldest. October was the third coldest and December the 14th coldest in the United States in 115 years.
Global warming and cooling are cyclical. Data show it warmed from 1920 to 1940 and again from 1979 to 1998. But temperatures cooled from 1940 to the late 1970s, and have been cooling since 2001. Since World War II, CO2 has risen, even as temperatures have cooled, warmed and then cooled again, undermining the theory that CO2 is the single most important cause of climate change.
Not a single official computer model predicted the recent decline (since 2001) in global temperatures. Yet extended projections from the same models are referenced by eco-alarmists demanding draconian CO2-emission controls and the imposition of carbon taxes and cap-and-trade restrictions.
See more on on the NOAA and NASA recipe and how they cook the books here. See the detailed SPPI paper here and E.M. Smith’s post here. See also John Coleman’s KUSI special which covered this topic here and the interview with E.M. Smith here. See some answers to NOAA and NASA rebuttals here (fuller response coming today). Scroll down to see the point-by-point responses.
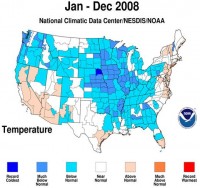
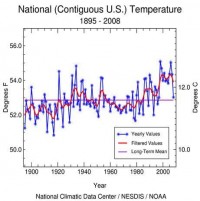
NOAA versus NASA: US Data
By Steve McIntyre, Climate Audit
Anthony has a post reporting NOAA’s 2008 results, with NOAA reporting:
For 2008, the average temperature of 53.0 degrees F was 0.2 degree above the 20th Century average.
Enlarged map here.
Anthony showed the following image from NOAA (enlarged here):
Readers need to keep in mind that there is a substantial “divergence” between NOAA US and NASA US temperatures as shown in the graphic below. Since 1940, NOAA’s US has increased relative to NASA’s US at a rate of 0.39 deg C/century, thus 0.27 deg C since 1940.
Figure 2. Difference (deg C) between NOAA US and NASA US temperature anomalies (enlarged here).
At present, we don’t know very much about the NOAA calculation. To my knowledge, they make no effort to make a UHI adjustment along the lines of NASA GISS. As I’ve mentioned before, in my opinion, the moral of the surfacestations.org project in the US is mainly that it gives a relatively objective means of deciding between these two discrepant series. As others have observed, the drift in the GISS results looks like it’s going to be relatively small compared to results from CRN1-2 stations - a result that has caused some cackling in the blogosphere. IMO, such cackling is misplaced. The surfacestations results give an objective reason to view the the NOAA result as biased. It also confirms that adjustments for UHI are required. Outside the US, the GISS meta-data on population and rural-ness is so screwed up and obsolete that their UHI “adjustment” is essentially random and its effectiveness in the ROW is very doubtful. Neither NOAA nor CRU even bother with such adjustments as they rely on various hokey “proofs” that UHI changes over the 20th century do not “matter”. See post here.
----------------------
December 14th Coldest, 11th Wettest for the United States
By Joseph D’Aleo
Note: Key West came within 1 degree of their all time record low with 42F. The coldest was 41F set in 1981 and 1886. In a southwest suburb of Miami (West Kendall Airport), it dropped to 26F this morning.
The average temperature in December 2009 was 30.2 F. This was -3.2 F cooler than the 1901-2000 (20th century) average, the 14th coolest December in 115 years. The temperature trend for the period of record (1895 to present) is 0.1 degrees Fahrenheit per decade (enlarged here).
See state by state ranking below (enlarged here).
2.88 inches of precipitation fell in December. This was 0.65 inches more than the 1901-2000 average, the 11th wettest such month on record. The precipitation trend for the period of record (1895 to present) is 0.02 inches per decade (see enlarged here).
After a cold first half of January, a “January thaw”, a singularity that appears most reliably in cold winters around the third week of January will overpread much of the nation the next week before cold weather returns late in the month. Snowcover will slow the surface warming (see enlarged here).
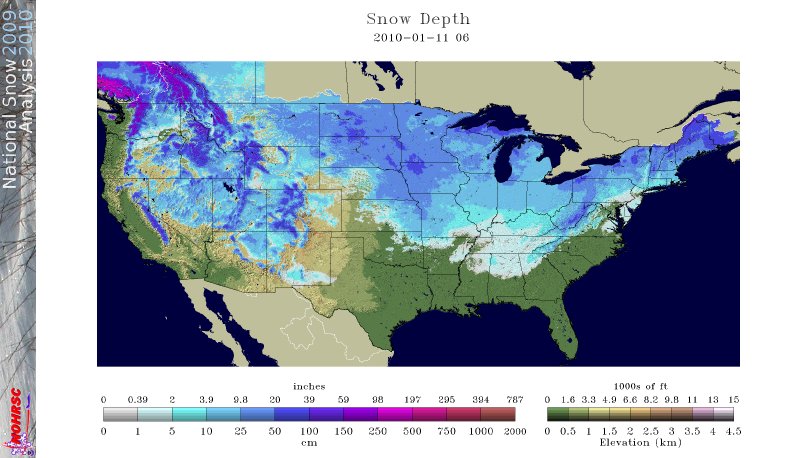
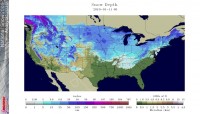
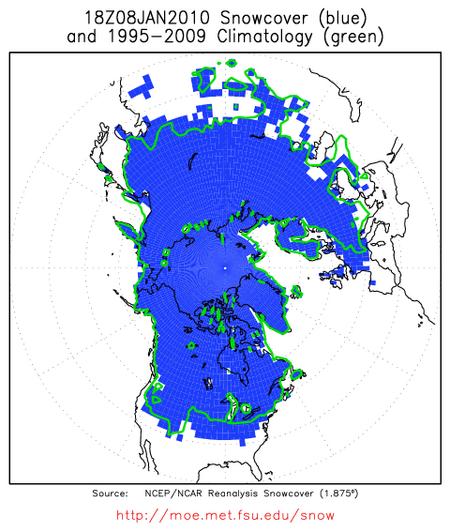
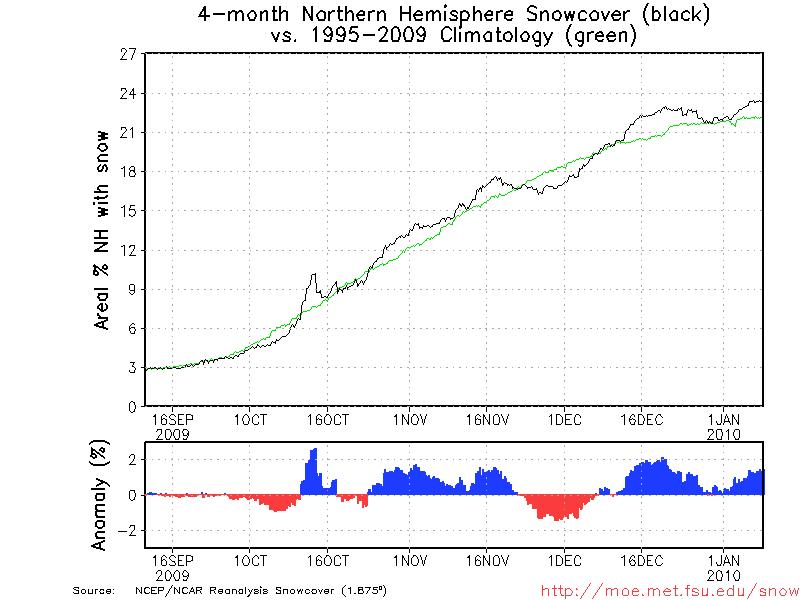
Globally, the snowcover is well above normal. (see enlarged here).

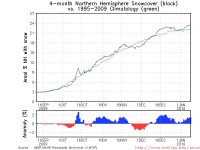
Enlarged here.
As often happens in winters when major blocking - arctic warming (negative AO) occurs in December, it eases briefly allowing for a more zonal flow and some brief moderation in the United States, western Europe and China for a few days then repeats again in mid to late winter. After this ‘January thaw the next week or so, expect more December like cold and snow, to reprise by late January and February. That should ensure the winter of 2009/10 will for these locations average among the colder winters in quite a while, even with the cooked data sets.
The Global Data for December and 2009
NOAA tells us: “The globe recorded its eighth warmest December since record keeping began in 1880, and 2009 tied with 2006 as the fifth warmest year on record, according to NOAA’s National Climatic Data Center. NASA’s Goddard Institute for Space Studies rated December 2009 as the 4th warmest December on record, and the year 2009 tied with 2007 as the second warmest year on record (in 135 years. NOAA rated December 2009 ocean temperatures as the 2nd warmest on record, next to 1997, and land temperatures as the 31st warmest on record. The anomalously cool conditions over much of northern Asian and North American land areas may be associated with the near record December snow cover extent over Northern Hemisphere land areas--2nd most on record, behind 1985. Snow cover records go back to 1967. The December global satellite-measured temperatures for the lowest 8 km of the atmosphere were the 7th warmest on record (in 31 years), according to the University of Alabama Huntsville and RSS data sets.
Scroll down to Icing the Hype and Icecap In the News sections to see the blockbuster stories on Glaciergate putting IPCC chief Pachauri on the hot seat and how non-peer review environmental activists studies were used by the IPCC to alarm us about the threat to the Amazon, which has become Amazongate. Also See how they are on the defensive too about trends in disaster losses. The IPCC is unravelling before our eyes.
-----------------------
UK Climate Change Activists Push for Average Speed Cameras
The UK Sustainable Development Commission yesterday released a report recommending the use of average speed cameras for round-the-clock tracking of motorist journeys nationwide. The government advisory body said that widespread deployment of average speed cameras was required to reduce the emission of carbon dioxide by automobiles, a factor that some believe is linked to global changes in temperature. The report made a number of recommendations affecting the driving public.
“The business models associated with private motoring are not aligned with sustainability,” the report explained.
The commission suggested that the government take immediate action to encourage the use of mass transit and discourage automobile use in general. Speed cameras were seen as an easy method of accomplishing this goal.
“Enforcing the speed limit has also been shown to be a very cost-effective way of reducing CO2 emissions from road transport with estimates of a reduction of 1.4 million tons of carbon dioxide simply by enforcing the 70 MPH speed limit,” the report claimed. “In 2009 the Home Office approved average speed cameras to enforce speed limits in urban areas. Cameras are networked together and can be placed at entry and exit points to an area with a fixed speed limit, for example 20 or 30 MPH.”
The report also called for a “clear timetable” for the introduction of Intelligent Speed Adaptation technology that would use global positioning satellites to take away control of vehicle speed from the driver, making it impossible for a car to exceed the limit on a given road. The same information communications technology (ICT) infrastructure could be used for congestion pricing, tolling of every journey and charging for insurance by the number of miles driven. The commission explained that such systems would require a substantial and ongoing financial investment.
“ICT does tend to need higher revenue funding to maintain and upgrade systems once in place,” the report conceded. “Systems will have continuous running costs and may need regular software updates. Computer hardware can have a working lifetime of as little as five to ten years.”
Motoring advocates responded that imposing average speed cameras, often known as SPEC cameras, would reduce safety.
“SPEC systems do nothing for good drivers, making them become zombie-like,” Safe Speed co-founder Claire Armstrong said. “Their visual search patterns are altered and compromised, drivers say it is like driving in a fog. They tailgate and stop paying attention, traffic bunches, and drivers become mentally tried, having to spend a disproportionate amount of time concentrating on their speed.”
The Association of British Drivers pointed out that much of the climate change rationale that underpins works like that of the Sustainability Commission are based on discredited claims by the United Nations Intergovernmental Panel on Climate Change (IPCC).
“The evidence is now overwhelming that the UN IPCC reports have tried to scare governments into submission with doomsday scenarios—perhaps to distract them from the poor quality of the ‘evidence’ supporting their assertion that mankind’s CO2 emissions really do drive the climate,” ABD Environment spokesman Paul Biggs said. “This is an exercise in global warming alarmism aimed at underpinning ‘green’ taxes and restrictions on the general public, with a disproportionate focus on drivers.”
As evidence, ABD pointed to three recent scandals. In the first, leaked emails from respected climate scientists described how charts were manipulated to “hide the decline” in global temperatures in IPCC reports. ABD then pointed to an IPCC report author’s recent admission that the claim that the Himalayan glaciers would melt by 2035 was false. Finally, the group showed how the IPCC linked the issue of climate change to the severity of disasters such as hurricanes and floods without proper scientific scrutiny. Read story here.
A U.S. ClimateGate?
Investor’s Business Daily Editorial
Hoaxes: Climate researchers and the Weather Channel’s founder accuse NOAA and NASA of the same data manipulation as Britain’s Climate Research Unit. Were weather stations cherry-picked to hide the temperature drop?
We recently commented on how our space agency for two years refused Freedom of Information requests on why it has had to repeatedly correct its climate figures.
In a report on global warming on KUSI television by Weather Channel founder and iconic TV weatherman John Coleman, that reticence has been traced to the deliberate manipulation and distortion of climate data by NASA.
As Coleman noted in a KUSI press release, our two primary climate centers, the National Climatic Data Center (NCDC) in Asheville, N.C., and NASA’s Goddard Institute for Space Studies at Columbia University in New York City, are accused of “creating a strong bias toward warmer temperatures through a system that dramatically trimmed the number and cherry-picked the locations of weather observation stations they use to produce the data set on which temperature record reports are based.”
Joseph D’Aleo, of Icecap.us, said the analysis found NOAA “systematically eliminated 75% of the world’s stations with a clear bias toward removing higher-latitude, high-altitude and rural locations.” The number of actual weather stations used to calculate average global temperatures was reduced from about 6,000 in the 1970s to about 1,500 today. The number of reporting stations in Canada dropped from 600 to 35.
E. Michael Smith, a computer programming expert who worked with D’Aleo, said he found “patterns in the input data from NCDC that looked liked dramatic and selective deletions of thermometers from cold locations.” The more he looked, the more he found “patterns of deletion that could not be accidental.”
Stations in places such as the Andes and Bolivia have virtually vanished, meaning, according to D’Aleo, temperatures from these areas are now “determined by interpolation from stations hundreds of miles away on the coast or in the Amazon.” He says it’s as if Minneapolis stopped reporting and its average temperature was extrapolated from readings in St. Louis and Kansas City.
Smith argues that the decrease in stations used and the selectivity of locations make NASA’s data and conclusions suspect. D’Aleo goes further, saying such cherry-picking and data manipulation are a “scientific travesty” committed by activist scientists to advance the global warming agenda.
To us, it looks like just another example of ideologically driven climate deceit following the Climate Research Unit scandal and the fraudulent claim by the U.N.’s Intergovernmental Panel on Climate Change that Himalayan glaciers would soon vanish.
See more here. See full report now from Joseph D’Aleo and Anthony Watts here.
---------------------------
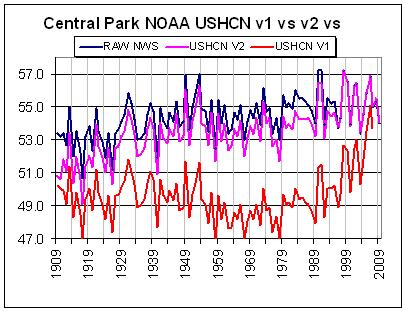
Central Park Revisited
By Joseph D’Aleo
We had earlier analyses posted here on Central Park comparing old data sets like USHCN version 1, the original raw observations as still downloadable from the NWS site in New York City and the GHCN v2. Version 2 city data is now available for USHCN. I would guess GHCN v3 rumored to be coming out this year will be the same as USHCN v2 (but can’t guarantee). In any event here is the plot of USHCN versions 1 and 2 together with raw for Central Park (below, enlarged here).
And the differences between the raw and USCHN v1 and v2 (below enlarged here).
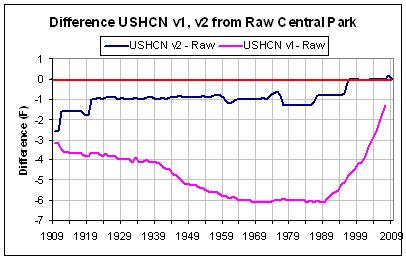
The most obvious thing that jumps out from the chart for the USHCNv1-Raw is the cooling (UHI) that peaked at just over 6 degrees in the 1980s then inexplicably diminished after 1999 slowly and disappeared in 2007 when version 2 was issued. For version 2, a reduction of 2.6 for the first two years (1909-1910) gradually diminishes to vanish in recent years.
Obviously adjustments here like in the many other locations are enhancing warming. More to come.
-----------------------
Climate-gate Redux
By Jane Jamison
Climate-gate part I occurred in early December when a still-unknown person posted thousands of e-mails and documents on a scientific website. The e-mails showed that scientists at the leading “global warming” research institute in the world, East Anglia University’s Climate Research Unit (CRU) had “changed” weather data to prove their climate-warming theories, and squelched dissenting opinions from skeptical scientists to maintain credibility for their fraud.
Climate-gate part II begins now: The scientists with Icecap.us website announced findings late last week that not only was the CRU involved in producing fraudulent weather data, but two United States agencies, National Aeronautics and Space Administration (NASA) and National Oceanographic and Atmospheric Administration (NOAA), have also been falsifying climate reports for years. NOAA, the report concludes, is actually “ground-zero” for the fraud of global warming, not the East Anglia Institute.
Climate researchers have discovered that government researchers improperly manipulated data in order to claim 2009 as “THE SECOND WARMEST YEAR ON RECORD.”
In a new report supported by SPPI, computer expert E. Michael Smith and Certified Consulting Meteorologist Joseph D’Aleo discovered extensive manipulation of the temperature data by the U.S. Government’s National Climate Data Center (NCDC) in Asheville, North Carolina Smith and D’Aleo accuse these centers of manipulating temperature data to give the appearance of warmer temperatures than actually occurred by trimming the number and location of weather observation stations and then ‘adjusting’ the data in ways that increase the apparent warming.
The results of Smith and D’Aleo’s findings were aired in a special on KUSI-TV hosted by founder of the Weather Channel and long-time meteorologist and climate “realist”, John Coleman.

DAleo’s preliminary report is HERE. Segments of the KUSI-TV report are HERE. SPPI’s website will print the final report soon.
Bottom line: Just about everyone involved with the “global warming” movement was faking and lying about faking their reports.
Not related directly to the investigation by the climate-gate scientists, but related nonetheless was another new report:
Polar bears are not dying or drowning due to melting icebergs caused by climate change. There are so many polars bears in Canada, they are causing problems.
This news is coming from Canadian wildlife agencies that have real live Inuit Indian hunters who count the real, live polar bears on the ground and in the water. The United States Geologic Survey (USGS), which has made the alarming findings about polar bear populations being extinct in 20 years, fly over in helicopters and make reports based on “analysis"of weather predictions.
Gabriel Nirlungayuk, director of wildlife for Nunavut Tuungavik Inc.says it is getting “beary” scary in many Canadian towns: During the summer and fall, families enjoying outdoor activities must be on the look-out for bears. Many locals invite along other hunters for protection.
Last year, in Pelly Bay, all the bears that were captured were caught in town, Nirlungayuk says. “You now have polar bears coming into towns, getting into cabins, breaking property and just creating havoc for people up here,” he says.
In the Western Hudson Bay area, where harvest quotas were reduced by 80 percent four years ago, communities are complaining about the number of polar bears. “Now people can look out the window and see as many as 20 polar bears at the ice-flow edge.”
Let the scientists report further on the intricacies of the graphs, maps, and calculations of “global warming fraud,” and then turn it all over to a prosecutor and make these “scientists” pay for this outrageous hoax that has continued for decades and is still having huge financial impacts on policy, commerce and the economy. “Global warming” is a crime. Read more here.
-------------------------
Pew Center Survey on Top Priorities for 2010
Global Warming and the Environment
Dealing with global warming ranks at the bottom of the publics list of priorities; just 28% consider this a top priority, the lowest measure for any issue tested in the survey. Since 2007, when the item was first included on the priorities list, dealing with global warming has consistently ranked at or near the bottom. Even so, the percentage that now says addressing global warming should be a top priority has fallen 10 points from 2007, when 38% considered it a top priority. Such a low ranking is driven in part by indifference among Republicans: just 11% consider global warming a top priority, compared with 43% of Democrats and 25% of independents.
Image enlarged here.
See post here.
Met Office computer accused of ‘warm bias’ by BBC weathermanBy Mail On Sunday Reporter
A BBC weather forecaster has suggested that the Met Office’s super-computer has a ‘warm bias’ which has stopped it predicting bitterly cold spells like the one we have just endured.

Paul Hudson said the error may have crept into the computer’s climate model as a result of successive years of milder weather. His claim was rejected by the Met Office but other experts said there could be flaws in the system, which was first developed 50 years ago.
In a blog, the BBC Look North presenter writes: ‘Clearly there is the rest of January and February to go, but such has been the intensity of the cold spell...it would take something remarkable for the Met Office’s forecast (of a mild winter) to be right.
‘It is also worth remembering that this comes off the back of the now infamous barbecue summer forecast. ‘Could the model, seemingly with an inability to predict colder seasons, have developed a warm bias, after such a long period of milder than average years?’
The Met Office produces its forecasts by feeding information from sources, including satellites and weather stations, into a ‘climate model’. A set of complex equations then predict weather changes.
Mr Hudson appears to be suggesting that data recorded over the past decade of warmer winters could be unduly influencing the computer’s calculations.
However, the Met Office denies this, saying ‘any small biases’ are automatically corrected before it issues seasonal forecasts.
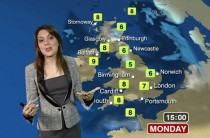
Modern look: Laura Tobin gives tomorrow’s weather forecast using the 3D map created by Metra, who are the Met Office rivals for the next BBC contract
The rumpus comes as the BBC considers dropping the Met Office forecasts after almost 90 years. The contract runs out in April and the broadcaster has been in talks with the New Zealand forecasters, Metra.
Again, accuracy is the issue, with the Met Office coming under severe criticism over the prediction of a barbeque summer last July. The UK suffered a washout. And its forecast of a mild winter attracted derision as temperatures plunged to as low as -22C in parts of Britain.
A poll commissioned by the Sunday Times this weekend found that 74 per cent of people saying they believed forecasts were inaccurate. However, the Met Office staff are still in line for a bonus, with a muted pot of 1million pounds to share out.
Metra already produces graphics for the BBC including the 3D weather map that brough complaints when it was introduced in 2005. A Metra source is quoted as telling the Sunday Times: ‘The BBC is not very happy with the service it has been getting from the Met Office, it thinks it’s too expensive. We have the ability to provide a bespoke service that will undercut it. ‘Because we already produce graphics we’ve got a foot in the door, so we’re optimistic.’
Read more here.
Icecap Note: Though a bit of a welcome break part of the next week or so as some Atlantic air breaks through into western Europe, eventually the action will shift south and more cold will come from the east with perhaps still more snow end of the month.
See also here some insightful comments on dynamical long range forecasting by Dr. Madhav Khandekar.
By Paul Chesser, Spectator Blog
The Commonwealth Foundation in Harrisburg, Pa. does not trust Pennsylvania State University to investigate Climategate hockey sticker Michael Mann, because of the millions of dollars that his research brings to the university. The foundation today released a 12-page policy brief which addresses Mann’s Climategate emails, the significance of his role, and why the university has a conflict of interest in investigating him. Commonwealth held a press conference today at the state capitol about their report:
The hockey stick controversy and Climategate emails reveal that Michael Mann may have committed significant and intentional scientific misconduct, including improper data manipulation, inappropriately shielding research methods and results from others, and engaging in a number of forms of retaliation against those who publicly challenge his research results.
Were scientific misconduct a criminal matter, the aforementioned facts might be said to constitute “probable cause” for a search warrant. Analogously, these facts provide probable cause for an investigation into Mann’s conduct at PSU.
Although PSU has announced that it will investigate Climategate, given Mann’s financial and reputational value to the university, and the likely embarrassment resulting from an adverse finding concerning his conduct, there is good reason to believe that a PSU-managed investigation might amount to little more than a whitewash.
Commonwealth Foundation goes on to recommend that the state General Assembly commission an external, independent investigation. Pennsylvania State Senate Education Committee Chairman Jeffrey Piccola has already promised Penn State that if its investigation is a whitewash, he will do one that isn’t. See post here.
See follow-up story here:
See in the college newspaper, the Daily Caller, how Mann is Protected to the Maximum Extent Under PSU Policy here.
By Charles Homans, Columbia Journalism Review
The small makeup room off the main floor of KUSI’s studios, in a suburban canyon on the north end of San Diego, has seen better days. The carpet is stained; the couch sags. John Coleman, KUSI’s weatherman, pulls off the brown sweatshirt he has been wearing over his shirt and tie all day and appraises himself in the mirror, smoothing back his white hair and opening a makeup kit. “I kid that I have to use a trowel, to fill the crevasses of age,” he says, swiping powder under one eye and then the other. “People have tried to convince me to use more advanced makeup, but I don’t. I don’t try to fool anyone.”
Coleman is seventy-five years old, and looks it, which is refreshing in the Dorian Gray-like environs of television news. He refers to his position at KUSI, a modestly eccentric independent station in San Diego whose evening newscast usually runs fifth out of five in the local market, as his retirement job. When he steps in front of the green screen, it’s clear why he has chosen it over actual retirement; in front of the camera he moves, if not quite like a man half his age, then at least like a man three quarters of it. His eyes light up, and the slight stoop with which he otherwise carries himself disappears. His rumble of a voice evens out into a theatrical baritone, full of the practiced jocularity of someone who has spent all but the first nineteen years of his life on TV.
By his own rough estimate, John Coleman has performed more than a quarter million weathercasts. It is not a stretch to say that he is largely responsible for the shape of the modern weather report. As the first weatherman on ABC’s Good Morning America in the late 1970s and early ‘80s, Coleman pioneered the use of the onscreen satellite technology and computer graphics that are now standard nearly everywhere. In 1982, chafing at the limitations of his daily slot on GMA, Coleman used his spare time - and media mogul Frank Batten’s money- to launch The Weather Channel. The idea seemed quixotic then, and his tenure as president ended a year later after an acrimonious split with Batten. But time proved Coleman to be something of a genius - the channel was turning a profit within four years, and by the time NBC-Universal bought it in 2008 it had 85 million viewers and a $3.5 billion price tag.
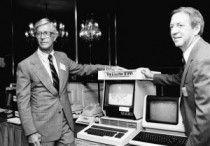
John Coleman and Frank Batten Sr. in 1982
Those were the first two acts of Coleman’s career. On a Sunday night in early November 2007, Coleman sat down at his home computer and started to write the 967 words that would launch the third. “It is the greatest scam in history,” he began. “I am amazed, appalled and highly offended by it. Global Warming: It is a SCAM.”
What had set him off was a football game. The Eagles were playing the Cowboys in Philadelphia on Sunday Night Football, and as a gesture of environmental awareness - it was “Green is Universal” week at NBC-Universal - the studio lights were cut for portions of the pre-game and half-time shows. Coleman, who had been growing increasingly skeptical about global warming for more than a decade, finally snapped. “I couldn’t take it anymore,” he told me. “I did a Howard Beale.”
Skepticism is, of course, the core value of scientific inquiry. But the essay that Coleman published that week, on the Web site ICECAP, would have more properly been termed rejectionism. Coleman wasn’t arguing against the integrity of a particular conclusion based on careful original research - something that would have constituted useful scientific skepticism. Instead, he went after the motives of the scientists themselves. Climate researchers, he wrote, “look askance at the rest of us, certain of their superiority. They respect government and disrespect business, particularly big business. They are environmentalists above all else.”
The Drudge Report picked up Coleman’s essay, and within days its author was a cause celebre on right-wing talk radio and cable television, beaming into Glenn Beck’s TV show via satellite from the KUSI studios to elaborate on the scientists’ conspiracy. “They all have an agenda,” Coleman told Beck, “an environmental and political agenda that said, ‘Let’s pile on here, we’re all going to make a lot of money, we’re going to get research grants, we’re going to get awards, we’re going to become famous.’”
Along with the appearances on Beck’s and Rush Limbaugh’s programs came speaking offers, and soon Coleman was on the conference circuit, a newly minted member of the loose-knit confederation of professional skeptics. (Coleman insists his views on climate change are apolitical, and says he has turned down offers to speak at Tea Parties and other conservative events.) His interviews and speeches that have been posted to YouTube have, in some cases, been viewed hundreds of thousands of times.
None of it would have had much of an impact, but for Coleman’s resume. For the many Americans who don’t understand the difference between weather -the short-term behavior of the atmosphere - and climate - the broader system in which weather happens - Coleman’s professional background made him a genuine authority on global warming. It was an impression that Coleman encouraged. Global warming “is not something you ‘believe in,’"he wrote in his essay. “It is science; the science of meteorology. This is my field of life-long expertise.”
Except that it wasn’t. Coleman had spent half a century in the trenches of TV weathercasting; he had once been an accredited meteorologist, and remained a virtuoso forecaster. But his work was more a highly technical art than a science. His degree, received fifty years earlier at the University of Illinois, was in journalism. And then there was the fact that the research that Coleman was rejecting wasn’t “the science of meteorology” at all- it was the science of climatology, a field in which Coleman had spent no time whatsoever (see John’s comments on Homans story here).
Coleman’s crusade caught the eye of Kris Wilson, an Emory University journalism lecturer and a former TV news director and weatherman himself, and Wilson got to wondering. He surveyed a group of TV meteorologists, asking them to respond to Coleman’s claim that global warming was a scam. The responses stunned him. Twenty-nine percent of the 121 meteorologists who replied agreed with Coleman - not that global warming was unproven, or unlikely, but that it was a scam. Just 24 percent of them believed that humans were responsible for most of the change in climate over the past half century- half were sure this wasn’t true, and another quarter were ‘neutral’ on the issue. “I think it scares and disturbs a lot of people in the science community,” Wilson told me recently. This was the most important scientific question of the twenty-first century thus far, and a matter on which more than eight out of ten climate researchers were thoroughly convinced. And three quarters of the TV meteorologists Wilson surveyed believe the climatologists were wrong.
In fact, anecdotal evidence of this disconnect had been accruing for several years. When a freakish snowstorm hit Las Vegas in December 2008, CNN meteorologist Chad Myers, appearing on Lou Dobbs Tonight, used the occasion to expound on his own doubts about global warming. “You know, to think that we could affect weather all that much is pretty arrogant,” he told Dobbs. “Mother Nature is so big, the world is so big, the oceans are so big.” Today’s most oft-quoted and influential skeptics include Joseph D’Aleo, The Weather Channel’s first director of meteorology, and Anthony Watts, a former Chico, California, TV meteorologist and prolific blogger who is leading a volunteer effort to document irregularities among the twelve hundred weather stations the National Weather Service maintains across the country (a concern that the National Oceanic and Atmospheric Administration considers negligible, and in any case has factored into its calculations since the ‘90s). When Oklahoma Senator James Inhofe, Congress’s most reliable opponent of climate-change legislation, presented a list of more than four hundred “science authorities” who disagreed with the prevailing scientific opinion on climate change in 2008, forty-four of them were TV weathercasters. And after the signature of Mike Fairbourne, the weatherman for Minneapolis’s CBS affiliate, turned up on a similar petition that year, reporters for the Minneapolis Star Tribune called around and found that hardly any of the city’s TV weathercasters believed in climate change; one had recently called the idea “crazy” on a local talk-radio show.
More striking is the fact that the weathercasters became outspoken in their rejection of climate science right around the time the rest of the media began to abandon the on-the-one-hand, on-the-other-hand approach that had dominated their coverage of the issue for years, and started to acknowledge that the preponderance of evidence lay with those who believed climate change was both real and man-made. If anything, that shift radicalized the weathermen. “I think the media is almost sleeping with the enemy,” one meteorologist told me. “The way it is now, there is just such a bias as to what gets out.”
Free-market think tanks like the Heartland Institute, knowing an opportunity when they see one, now woo weathercasters with invitations to skeptics’ conferences. The National Science Foundation and the Congress-funded National Environmental Education Foundation, meanwhile, are pouring money into efforts to figure out where exactly the climate scientists lost the meteorologists, and how to win them back. The American Meteorological Society (AMS) which formally endorsed the scientific consensus on climate change years ago, but counts many of the skeptics among its members, to its chagrin - started including climate-change workshops for weathercasters in its conferences. For all of their differing agendas, the outfits have one thing in common: they have all realized that, however improbably, the future of climate-change policy in the United States rests to a not-insubstantial degree on the well-tailored shoulders of the local weatherman.
In the fall of 2008, researchers from George Mason and Yale universities conducted the most fine-grained survey to date about what Americans know and think about climate change. The short answer, unsurprisingly, was not very much. “Climate change is an incredibly complicated subject,"says Anthony Leiserowitz, director of the Yale Project on Climate Change and one of the study’s co-authors. “Most people are not interested in digging through the scientific literature, and in that situation trust becomes an enormous factor. We rely on people and organizations to guide us through this incredibly complicated and risky landscape.”
That was where the survey’s findings got interesting. When asked whom they trusted for information about global warming, 66 percent of the respondents named television weather reporters. That was well above what the media as a whole got, and higher than the percentage who trusted Vice-President-turned-climate-activist Al Gore, either of the 2008 presidential nominees, religious leaders, or corporations. Scientists commanded greater credibility, but only 18 percent of Americans actually know one personally; 99 percent, by contrast, own a television. “Meteorology benefits from the fact that we’re just about the only science that has an individual in people’s living rooms every night,” says Keith Seiter, the executive director of the American Meteorological Society. “For many people, it’s the only scientist whose name they know.”
There is one little problem with this: most weathercasters are not really scientists. When Wilson surveyed a broader pool of weathercasters in an earlier study, barely half of them had a college degree in meteorology or another atmospheric science. Only 17 percent had received a graduate degree, effectively a prerequisite for an academic researcher in any scientific field.
This case of mistaken identity has been a source of tension throughout television’s sixty-odd-year history. When TVs began to proliferate in postwar American households, the first generation of weathercasters that viewers saw on them was mostly military men, recently discharged World War II veterans who had trained in meteorology in the Navy and the Army Air Corps. (Louis Allen, Washington, D.C.’s first TV weatherman, had drawn up the forecasts for the invasions of Iwo Jima and Okinawa.) But as broadcasting licenses multiplied and stations began to compete with each other in the ‘50s, meteorologist Robert Henson recounts in Weather on the Air: A History of Broadcast Meteorology (to be published this year), the Army men gave way to entertainers: scantily clad “weather girls” abounded, as did puppets, including one who divined the forecast with his handlebar mustache. A weatherman in Nashville read his forecast in verse. One New York station featured a “weather lion.”
After a few years of this sort of thing, the American Meteorological Society decided to step in; the professional association’s membership, then comprised mostly of government and academic meteorologists, had grown wary of what the weather girls were doing to their reputation. The society devised a voluntary meteorological certification system, a seal of approval that TV weathercasters could obtain with the right academic background - at least a bachelor’s degree in meteorology - or demonstrated knowledge in the field. (This seal is what technically distinguishes a meteorologist from a weathercaster.) In a 1955 TV Guide article entitled “Weather is No Laughing Matter,” AMS member Francis Davis wrote that “If TV weathermen are going to pose as experts, we feel they should be experts.”
Although it took years, Davis’s view eventually won out. By the end of the ‘70s, weathercasters had begun to treat their responsibilities with some seriousness. They started to see themselves as everyman (they were still mostly men) scientists, authority figures who helped viewers not only anticipate once-unpredictable events, but also comprehend them. And when you think about it, the achievement weathercasters have pulled off as science educators is remarkable - ask anyone with a television to name some meteorological terms, and odds are they will be able to rattle off half a dozen: low pressure systems, wind shear, cumulonimbus clouds. Weathercasters are usually a sort of science ambassador to their communities as well, and spend as much time talking to elementary school classes and civic groups about science as they do forecasting on the air. The work hasn’t gone unappreciated; heaps of audience research have identified the weather report as the most popular segment of the local news broadcast, and the biggest factor in viewers choice of which newscast to watch. Even as Americans’ trust in the media as a whole has cratered, love for the weatherman has persisted at levels unchanged since Walter Cronkite’s day.
The Clinton administration had all of this in mind in October 1997, when it gathered meteorologists from dozens of the nation’s biggest television markets at the White House for a special summit on climate change. In two months, negotiators would be meeting in Kyoto to renegotiate the United Nations Framework Convention on Climate Change, the talks that would ultimately produce the Kyoto Protocol. Americans were still largely uninformed about climate change, and the White House was hoping the weathercasters could help bring them up to speed. More than one hundred of them showed up to hear speeches from Gore - an early version of the slideshow later documented in An Inconvenient Truth - and President Bill Clinton, as well as leading NOAA climate researchers.
As the administration had hoped, the meteorologists used the occasion to opine about climate change - but what many of them said wasn’t quite what Al Gore had in mind. “There’s still a significant segment of the scientific community that’s not sold on this,” Harvey Leonard, then the weatherman at WHDH in Boston, told The Washington Post. Others loudly refused to attend the summit, including all but one of the weathercasters in the Oklahoma City market. “I’m not smart enough to know [if the earth is warming], and I don’t think any person on the planet is,” KOKH meteorologist Tim Ross told the Daily Oklahoman. The following month, twenty TV weather personalities added their names to the Leipzig Declaration, a petition opposing the global warming theory.
It was only a blip on the radar, but it presaged the broader rejection of climate science that would come a decade later. The question was, why? No doubt, some of the blame belonged to the White House. In positioning themselves as advocates for not only a policy position but also a scientific one, Clinton and Gore had conflated the political question of what to do about climate change - one that was, and remains, deeply partisan in the U.S. - with the apolitical question of whether it was happening. This put the weathermen in a tricky spot - embracing what was, even then, the majority position in the scientific community would make them look like shills for the administration. “Since the White House is behind it, it’s political,” Leonard told the Post. “I’m not a lap dog,’ Gary England of KWTV in Oklahoma City-now a prominent climate skeptic-told the Daily Oklahoman. “I think Al Gore’s motives were pretty good-he saw early on the potential that these people had,” Kris Wilson says. “But he was probably the wrong spokesman. As journalists, we’re taught to be skeptical, right? We’re taught that if your mother says she loves you, get a second source.”
But the disagreement, then as now, also came down to the weathercasters themselves, and what they knew-or believed they knew. Meteorology has a deceptively close relationship with climatology: both disciplines study the same general subject, the behavior of the atmosphere, but they ask very different questions about it. Meteorologists live in the short term, the day-to-day forecast. It’s an incredibly hard thing to predict accurately, even with the best models and data; tiny discrepancies matter enormously, and can pile up quickly into giant errors. Given this level of uncertainty in their own work, meteorologist looking at long-range climate questions are predisposed to see a system doomed to terminal unpredictability. But in fact, the basic question of whether rising greenhouse gas emissions will lead to climate change hinges on mostly simple, and predictable, matters of physics. The short-term variations that throw the weathercasters’ forecasts out of whack barely register at all.
This is the one explanation that everyone who has mulled the question seems to agree on-and indeed, when I spoke with meteorologists who were skeptical of or uncertain about the scientific consensus, it was the one thing they all brought up. “Meteorologists know our models,” Brian Neudorff, a meteorologist at WROC in Rochester, New York, told me. “There’s a lot of error and bias. We’ll use five different models and come back with five different things. So when we hear that climatological models are saying this, how accurate are they?”
But that hardly explains why so many meteorologists have disregarded the mountain of evidence of global warming that has already occurred-or why, in the case of the hard-line skeptics, they are so fixated on proving a few data sets’ worth of tree-ring and ice core measurements wrong. “I think a lot of people have theories,” Robert Henson says, “but nobody knows for sure.”
In the absence of a clear answer, several institutions-the National Environmental Education Foundation (NEEF), the Yale Forum on Climate Change & the Media, and the University Corporation for Atmospheric Research among them-have decided that education is the problem, and have launched projects aimed at teaching the weathercasters the basics of climatology. All proceed from the assumption that unreachable skeptics like Coleman are few and far between, and that most meteorologists are more uncertain than adamant, lost amid the Internet’s slurry of fact and counterfact. “While there is a group that seems to have made up their mind about climate change, there’s still a substantial portion that’s interested in learning more,” says Sara Espinoza, a program director at NEET. The AMS-which finds its credibility threatened by its televised emissaries a second time-is working with NEEF on a do-it-yourself climate science education package for meteorologists that points them to government data and peer-reviewed research. It is part of the AMS’s broader “station scientist” program, which aims to give meteorologists the tools they need to become the go-to authorities in their newsrooms on all scientific subjects, not just the weather. In essence, it is a doubling down on the wager that the AMS made fifty-five years ago: if viewers are going to assume weathercasters are experts anyway, we might as well try to make them experts.
It remains a laudable goal. But in my own conversations with skeptical meteorologists, I began to think that that earlier effort had helped create the problem in the first place. The AMS had succeeded in making many weathercasters into responsible authorities in their own wheelhouse, but somewhere along the way that narrow professional authority had been misconstrued as a sort of all-purpose scientific legitimacy. It had bolstered meteorologists sense of their expertise outside of their own discipline, without necessarily improving the expertise itself. Most scientists are loath to speak to subjects outside of their own field, and with good reason-you wouldn’t expect a dentist to know much about, say, the geological strata of the Grand Canyon. But meteorologists, by virtue of typically being the only people with any science background at their stations, are under the opposite pressure-to be conversant in anything and everything scientific. This is a good thing if you see yourself as a science communicator, someone who sifts the good information from the bad-but it becomes a problem when you start to see scientific authority springing from your own haphazardly informed intuition, as many of the skeptic weathercasters do. Among the certified meteorologists Wilson surveyed in 2008, 79 percent considered it appropriate to educate their communities about climate change. Few of them, however, had taken the steps necessary to fully educate themselves about it. When asked which source of information on climate change they most trusted, 22 percent named the AMS. But the next most popular answer, with 16 percent, was “no one.” The third was “myself.”
The biggest difference I noticed between the meteorologists who rejected climate science and those who didn’t was not how much they knew about the subject, but how much they knew about how much they knew-how clearly they recognized the limits of their own training. Among those in the former category was Bob Breck, the AMS-certified chief meteorologist at Fox affiliate WVUE in New Orleans and a thirty-two-year veteran of the business. Breck rejected the notion of human-driven climate change wholesale-"I just find that [idea] to be quite arrogant,” he told me. Instead, when Breck talked to local schools and Rotaries and Kiwanis clubs about climate change, he presented his own ideas: warming trends were far more dependent on the water vapor in the atmosphere than carbon dioxide, he told them, and the appearance of an uptick in global temperatures was the result of the declining number of weather stations in cold rural areas.
These theories were not only contradictory of each other, but had also been considered and rejected by climate researchers years ago. But Breck didn’t read much climate research; “the technical journals are controlled by the professors who run the various societies,” he told me, and those professors were hopelessly dependent on the “gravy train of grants from the NSF” that required them to propagate “alarmist theories.” When I mentioned the AMS, Breck bristled. “I don’t need the AMS seal-which I have,” he said. “I don’t need their endorsements. The only endorsements I need are my viewers, and they like what I do.”
As Breck went on, I began to get a sense of the enormity of the challenge at hand. Convincing someone he is an expert is one thing. Actually making him one-well, that is another thing entirely.” See story here.
Icecap note: Homans claims TV meteorologists are skeptical because they have to deal with imperfect weather data and models without realizing that greenhouse gases and atmospheric physics are disconnected and indisputably driving climate. He like most journalists is himself guilty of not investigating whether this may be wrong and the TV mets and other scientists not riding the gravy train could be right that climate change (which no one disputes) may be to a large degree natural and man’s role primarily local and due to land use changes and urbanization.
Special Weather Statement
National Weather Service Melbourne Fl
651 AM EST Saturday Jan 9 2010
Light sleet and snow flurries continue to mix with rain across Brevard, Lake, Orange, Osceola, Seminole and Volusia Counties.
Numerous surface observations and weather spotters continue to report rain mixing with light sleet and snow flurries across an area north of a line from Melbourne to Kenansville. Intermittent periods of a rain, sleet, and snow flurries with little to no accumulation are forecasted to continue across this same area through mid-morning.
Temperatures are continuing to fall across Indian River County and a brief period of a rain sleet mix may occur especially across northern portions of the county in Sebastian and Fellsmere.
Though temperatures remain just above freezing in most locations, patchy ice may develop on area roadways, creating hazardous driving conditions. Bridges, overpasses and low spots usually will develop ice first. Slow down and use caution if driving on area roadways this morning.
Orlando International Airport at 8am was reporting 30F and light freezing rain. Earlier reported ice pellets. EPCOT marathon this morning may find runners in sleet and temperatures in the low to mid 30s and wind chills in the mid 20s. See the morning WESH video with meteorologist Tony Mainolfi here. Still image capture here
A rare scene for Florida below.
During the day, additional reports were received and plotted by the Melbourne NWS office here.
.jpg )
Also reports of snow flurries in Miami were received by the NWS, one report logged below (enlarged here). H/T Alexandre Aguiar, METSUL
By Alexandre Aguiar - MetSul Weather Center (Brazil)

Photos of the Juventud Rebelde newspaper from Cuba
How about a beach vacation in Cuba?
The Caribbean should be a great choice to avoid the harsh winter of the Northern Hemisphere, but at this moment it is not. If you go to Cuba, consider to take in the luggage a coat, gloves and a scarf. The Meteorological Institute of Cuba has been issuing daily bulletins on the cold snap in the country. On Thursday, the lowest temperatures in the island were recorded at Playa Giron (4.5C) and Santo Domingo (4.6C). Ciego de Avila had its lowest ever temperature recorded in January (5.2C), beating the old record of 6.0C of 1997. The same happened in Falla with a low of 5.4C, below the month record of 6.3 of 1981.
Others stations recorded on Thursday 5.5C in Aguada de Pasajeros, 6.0C in Jaguey Grande, 6.1C in Jucaro, 6,7 in Indio Hatuey, 6.9C in Yabu, 7.0 in Sagua La Grande, 7.3C in Colon, 7,4C in Sancti Spiritus, 7.5C in Jovellanos, 7.6C in Cienfuegos, 8.3C in Celsius Esmeralda, 8.4C in Union de Reyes, 8.5C in Batabano, 8.8C in Isabel Rubio and 9.7 in Tapeste. Caibarien had an all-time low for any month of the year with 10.7C, beating the old record of 10.8 of 1996.
This Friday, Cuba had another cold start to the day, but the Cuban Weather Service reported no records. The lowest temperatures in the country were observed in Indio Hatuey (6.6C), Santo Domingo (7.0C) and Bainoa (7.1). In other cities, the lows were 8.2C in Indio Jovellanos, 8.4C in Jaguey Grande, Colon and Esmeralda, 8.6C in Cienfuegos, 9.4C in Batabano, 9.5C in Tapaste and Sagua la Grande and 9.7C in Santa Clara and Sancti Spiritus.
The lowest ever recorded temperature in Cuba took place in Bainoa, Province of La Habana, on February 18th, 1996: 0.6C.
Read more here.
ICECAP Note: Another cold shot will occur this weekend, perhaps stronger
How cold is it? Lizards falling from trees
By Randall Dickerson
The frigid weather hampered Northern firefighters and even made life hard for Florida’s tree- dwelling iguanas. Freezing iguanas were seen falling out of trees. Experts say the coldblooded reptiles become immobilized when the temperature falls into the 40s and they lose their grip on the tree.

See video here on how to handle a frozen Iguana.
China cold/snow has trains stopped in their tracks
By Xin Dingding and Wang Qian (China Daily)
Falling mercury causes power shortages; cold spell to continue. Three days in a row, Beijing set record daily lows. It was -2F yesterday. It was the coldest day since 1971.
The heaviest snowfall to hit northern China in nearly six decades continued to snarl traffic yesterday, stranding thousands of passengers on railways and at airports. The unusually harsh winter weather also caused coal shortages, forcing some provinces to cut power supplies. Though snow stopped in most parts in the north by yesterday morning, heavy snowfall and biting cold continued in parts of Inner Mongolia, Hebei and Shandong.
The heavy snow led to the delay of 13 passenger trains in Inner Mongolia, and forced the closure of all four airports in Shandong, as well as 30 state highways in northern China. Beijing Capital International Airport, with more than 1,400 flights scheduled to take off yesterday, reported severe disruptions. By 4 pm, 485 flights took off, 690 flights were delayed for an average of 90 minutes, and 98 flights were canceled, an airport spokesman said.
A train from Harbin to Baotou ran into snow more than 2 m high near Jining in Inner Mongolia on Sunday and passengers were evacuated only yesterday. All 15 carriages were buried in snow and more than 1,400 passengers were stranded in the train without lighting and heating. Food and drinking water were also in shortage, the local railway bureau said. “The snow was so high because this area is at a lower elevation. It piled up quickly, and huge gales continued to blow more snow in,” Zhang Jianwen, an armed police officer from Ulanqab League who led the rescue work, told China Daily.
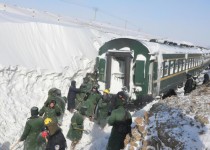
“Though snow stopped yesterday, the temperature was -28 C, freezing the doors,” he said. Armed police managed to pry open one door, and with the help of the local railway bureau, evacuated the 1,400 passengers to a nearby railway station yesterday. Nearly 2,000 people, including armed police, railway workers and farmers, worked to remove snow from the rail track with shovels, he sad. “For a whole day, we only ate a steamed bun each after waking up at 4 am,” Zhang said.
As the train blocked the line, two more passenger trains were affected, too. “Some 2,000 passengers were stranded on the two trains, but we delivered food to them,” he said. By 6 pm, snow was finally cleared away from the railway, and trains could pass through at a slow speed, a spokesman for the Hohhot railway bureau surnamed Han said.
With people turning up the heat indoors to fight the extreme cold across the country, many provinces are reducing electricity supply due to the shortage of coal. Since December, power has been cut or reduced to more than 2,000 factories in Wuhan, Hubei province, to ensure supply for household use, while most parts of the south face electricity shortages, Han Xiaoping, an energy analyst, said yesterday.
With power demand surging this winter, coal stocks in 349 power plants across the nation have decreased to around 27 million tons, or barely enough for 12 days of generation, while stocks in the north have declined to less than a week, the Shanghai Securities News reported last month. Generally, coal stocks should be enough for at least 20 days, Han said.
But in Hubei province, things are much worse. The local electricity supplier faces a shortage of 760,000 tons of coal before March this year, Yang Yong, assistant chief engineer at Hubei Electric Power Company, told China Business News yesterday. Nearly 2.4 gigawatts, or some 17 percent of the coal-fueled power generation capacity in Hubei, has been shut down due to coal shortage and there is a risk of even more output cuts, the newspaper reported yesterday. Electricity suppliers in the north are also facing a great challenge with the temperature falling drastically through the earlier part of this week. In the next 10 days, temperatures could fall to around -32 C in the far north and another cold wave will sweep the region around Friday, bringing gales and severe cold, the national forecaster said. Experts predicted that the power shortage would last till the end of this winter. See story here.
See here where the China Met Service blames the extreme cold and snow on global warming. The heaviest snow yesterday hit northeastern Asia, which is suffering its worst winter weather for 60 years. More than 25 centimetres (10in) of snow covered Seoul, the South Korean capital - the heaviest fall since records began in 1937.
----------------------------
Britain faces gas shortage in freezing weather
Britain is braced for the prospect of running short of gas as the country is gripped by one of the coldest winters for a century. For the second time ever, the National Grid yesterday issued a warning to energy providers that demand for gas is threatening to outstrip supply.
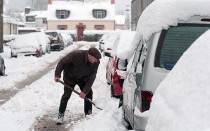
The ultimatum comes after a 30 per cent rise on normal seasonal demand as snow and freezing conditions continued their stranglehold on Britain. The concerns caused natural gas prices to jump to their highest level in 10 months yesterday, touching 45p a therm. While it is unlikely that households will find their supplies restricted, a shortage could lead to higher bills. The National Grid, responsible for meeting the country’s energy requirements, issued a gas balancing alert (GBA) yesterday to give warning that any further falls in supply could force big users like power plants to cut their consumption.
The National Pensioners Convention (NPC) called on the Government and energy companies to help pensioners through the cold spell which has seen temperatures dip to 12 degrees F (-11 degrees C). Figures from the Office for National Statistics revealed 23,740 pensioners died from a cold-related illness between December 2007 and March 2008 last year; 281 a day or 12 an hour. That was seven per cent rise from the previous year and the NPC warned that with increased fuel and food prices and the coldest start to January for over a decade, the number of deaths in the next three months could rocket. See story here.
The return of the cold PDO and quiet sun has similarities to the 1960s, and early 1900s, notoriously cold periods for winters in the hemisphere.
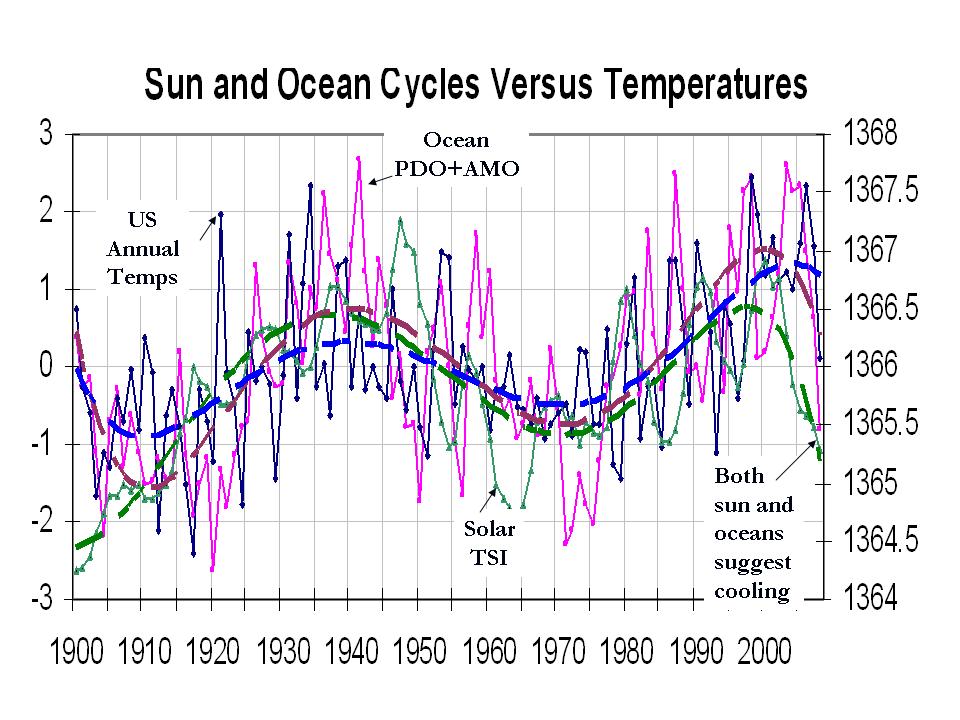
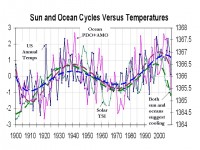
The similarities to the solar cycles in the late 1700s and early 1800s has many talking a Dalton Minimum, the time of Dickens and snowy London town. Hmmmm (below and enlarged here).
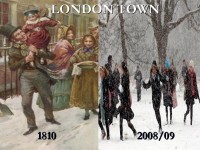
-----------------------
Hard-up pensioners have resorted to buying books from charity shops and burning them to keep warm.
Volunteers have reported that ‘a large number’ of elderly customers are snapping up hardbacks as cheap fuel for their fires and stoves.
Temperatures this week are forecast to plummet as low as -13C in the Scottish Highlands, with the mercury falling to -6C in London, -5C in Birmingham and -7C in Manchester as one of the coldest winters in years continues to bite.
Workers at one charity shop in Swansea, in south Wales, described how the most vulnerable shoppers were seeking out thick books such as encyclopaedias for a few pence because they were cheaper than coal. One assistant said: ‘Book burning seems terribly wrong but we have to get rid of unsold stock for pennies and some of the pensioners say the books make ideal slow-burning fuel for fires and stoves. A lot of them buy up large hardback volumes so they can stick them in the fire to last all night.’ A 500g book can sell for as little as 5 pence, while a 20kg bag of coal costs 5 pounds sterling.
Read more here.
By Doug L. Hoffman, the Resilient Earth
In an essay adapted from his 2009 AAAS Annual Meeting keynote address, James J. McCarthy has produced a fairly concise statement of the anthropogenic global warming believer’s world view. After a self-serving review of climate science history, McCarthy trots out the usual litany of climate change troubles: increased cyclones, rain and floods, rising sea levels and, of course, those pesky tipping points. The tone of the article is set early on, when research is cited stating that mankind’s impact on Earth is “sufficiently profound to declare that we have transitioned from the Holocene era of Earth history to the Anthropocene.”
McCarthy, professor of Biological Oceanography at Harvard and outgoing president of the AAAS, has done an admirable job in summarizing the main stream, “concensus view” version of climate science. His article, titled “Reflections On: Our Planet and Its Life, Origins, and Futures,” appeared in the December 18, 2009, issue of the AAAS journal Science. He begins with a quick rundown of how the CO2 centric AGW theory developed - a history that could have been cribbed from The Resilient Earth.
With the feelgood preliminaries disposed of, now comes the real meat of the article. What follows is a recitation of the basic beliefs of climate change alarmists. Much like Saint Paul’s first letter to the Corinthians, McCarthy’s article is a plea for unity among climate change believers in the face of various issues raised by skeptics. Like that epistle, the tenants of faith are layed out- humans are harming the planet in a myriad of ways, anthropogenic CO2 is primarily to blame, the IPCC models are correct, things are probably worse than they seem, and so on.
Much like St. Paul’s second letter to the Corinthians, McCarthy’s article is in part a defense of climate science’s ministry. In a strange twist on the doctrine of weakness being strength, the faults of the IPCC reports are called out as reasons to believe even more fervently in global warming:
Over the past two decades, many of the future climate projections from the IPCC and other groups have been proven to be conservative. This is in part because an IPCC assessment is by its very nature highly conservative. The content of an IPCC assessment is based on peer-reviewed publications in scientific journals. Thus, the most recent findings, perhaps already widely known among experts, may not be included in an assessment report if the work has not been published. Furthermore, recently published findings that have yet to be corroborated by other investigators may receive less emphasis than well-established work from an earlier period…
Unfortunately, when data confirm that projections for future climate have been overly conservative, this implies more serious negative impacts. Some aspect of the projected rates for greenhouse gas emissions or for the modeled climate response to these emissions has been underestimated.
So, welcome to the Anthropocene era, when humanity confesses to its sins against nature and repents its CO2 emitting ways. As penance the developed nations will lay waste to their industrial economies and the developing world abandon their dreams of a prosperous future. But even after bemoaning the decline in funding for Earth observations in NASA’s budget, the catalog of worsening conditions, and warnings that “there may yet be surprises” McCarthy finds succor in the new leadership of the Obama administration. “Never before have scientists been so influential in their active support of sound government policies, nor as selfless in accepting positions of great responsibility in the governance of our nation.” So here is his earnest plea- keep the faith. And make no mistake, belief in anthropogenic global warming has become a matter of faith not science.
Be safe, enjoy the interglacial and stay skeptical.
Read this full essay and review here.
Guest Editorial by Tom V. Segalstad on CO2Science
Essenhigh (2009), Professor of Energy Conversion at The Ohio State University, addresses the residence time (RT) of anthropogenic CO2 in the air. He finds that the RT for bulk atmospheric CO2, the molecule 12CO2, is ~5 years, in good agreement with other cited sources (Segalstad, 1998), while the RT for the trace molecule 14CO2 is ~16 years. Both of these residence times are much shorter than what is claimed by the IPCC. The rising concentration of atmospheric CO2 in the last century is not consistent with supply from anthropogenic sources. Such anthropogenic sources account for less than 5% of the present atmosphere, compared to the major input/output from natural sources (~95%). Hence, anthropogenic CO2 is too small to be a significant or relevant factor in the global warming process, particularly when comparing with the far more potent greenhouse gas water vapor.
The rising atmospheric CO2 is the outcome of rising temperature rather than vice versa. Correspondingly, Dr. Essenhigh concludes that the politically driven target of capture and sequestration of carbon from combustion sources would be a major and pointless waste of physical and financial resources.
Essenhigh (2009) points out that the IPCC (Intergovernmental Panel on Climate Change) in their first report (Houghton et al., 1990) gives an atmospheric CO2 residence time (lifetime) of 50-200 years [as a “rough estimate"]. This estimate is confusingly given as an adjustment time for a scenario with a
given anthropogenic CO2 input, and ignores natural (sea and vegetation) CO2 flux rates. Such estimates are analytically invalid; and they are in conflict with the more correct explanation given elsewhere in the same IPCC report: “This means that on average it takes only a few years before a CO2 molecule in the atmosphere is taken up by plants or dissolved in the ocean”.
Some 99% of the atmospheric CO2 molecules are 12CO2 molecules containing the stable isotope 12C (Segalstad, 1982). To calculate the RT of the bulk atmospheric CO2 molecule 12CO2, Essenhigh (2009) uses the IPCC data of 1990 with a total mass of carbon of 750 gigatons in the atmospheric CO2 and a
natural input/output exchange rate of 150 gigatons of carbon per year (Houghton et al., 1990). The characteristic decay time (denoted by the Greek letter tau) is simply the former value divided by the latter value: 750 / 150 = 5 years. This is a similar value to the ~5 years found from 13C/12C carbon isotope mass balance calculations of measured atmospheric CO2 13C/12C carbon isotope data by Segalstad (1992); the ~5 years obtained from CO2 solubility data by Murray (1992); and the ~5 years derived from CO2 chemical kinetic data by Stumm & Morgan (1970).
Revelle & Suess (1957) calculated from data for the trace atmospheric molecule 14CO2, containing the radioactive isotope14C, that the amount of atmospheric “CO2 derived from industrial fuel combustion” would be only 1.2% for an atmospheric CO2 lifetime of 5 years, and 1.73% for a CO2 lifetime of 7 years (Segalstad, 1998). Essenhigh (2009) reviews measurements of 14C from 1963 up to 1995, and finds that the RT of atmospheric 14CO2 is ~16 (16.3) years. He also uses the 14C data to find that thetime value (exchange time) for variation of the concentration difference between the northern and
southern hemispheres is ~2 (2.2) years for atmospheric 14CO2. This result compares well with the observed hemispheric transport of volcanic debris leading to “the year without a summer” in 1816 in the northern hemisphere after the 1815 Tambora volcano cataclysmic eruption in Indonesia in 1815.
Sundquist (1985) compiled a large number of measured RTs of CO2 found by different methods. The list, containing RTs for both 12CO2 and 14CO2, was expanded by Segalstad (1998), showing a total range for all reported RTs from 1 to 15 years, with most RT values ranging from 5 to 15 years. Essenhigh (2009) emphasizes that this list of measured values of RT compares well with his calculated RT of 5 years (atmospheric bulk 12CO2) and ~16 years (atmospheric trace 14CO2). Furthermore he points out that the annual oscillations in the measured atmospheric CO2 levels would be impossible without a short atmospheric residence time for the CO2 molecules.
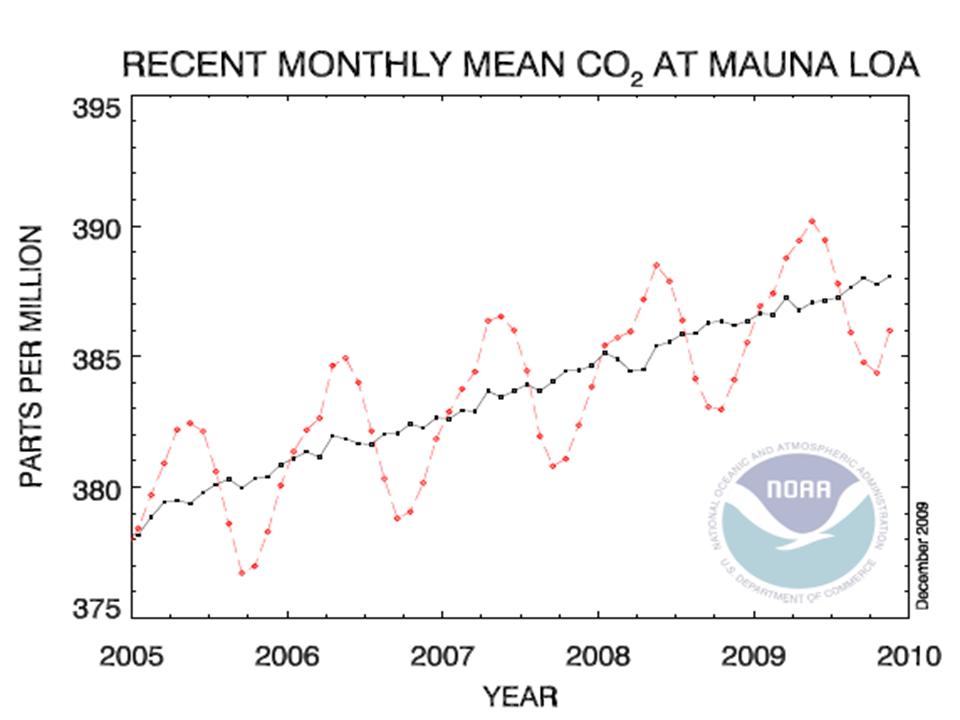
Essenhigh (2009) suggests that the difference in atmospheric CO2 residence times between the gaseous molecules 12CO2 and 14CO2 may be due to differences in the kinetic absorption and/or dissolution rates of the two different gas molecules. With such short residence times for atmospheric CO2, Essenhigh (2009) correctly points out that it is impossible for the anthropogenic combustion supply of CO2 to cause the given rise in atmospheric CO2. Consequently, a rising atmospheric CO2 concentration must be natural. This conclusion accords with measurements of 13C/12C carbon isotopes in atmospheric CO2, which show a maximum of 4% anthropogenic CO2 in the atmosphere (including any biogenic CO2), with 96% of the atmospheric CO2 being isotopically indistinguishable from “natural” inorganic CO2 exchanged with and degassed from the ocean, and degassed from volcanoes and the Earth’s interior (Segalstad, 1992).
Essenhigh (2009) discusses alternative ways of expressing residence time, like fill time, decay time, efold time, turnover time, lifetime, and so on, and whether the Earth system carbon cycle is in dynamic equilibrium or non-equilibrium status. He concludes (like Segalstad, 1998) that the residence time is a robust parameter independent of the status of equilibrium, and that alternative expressions of the residence time give corresponding values.
It is important to compare Essenhigh’s (2009) results with a recently published paper in PNAS by Solomon et al. (2009), the first author of which (Susan Solomon) co-chairs the IPCC Working Group One, the part of the IPCC that deals with physical climate science. This paper was published after Essenhigh had submitted his manuscript to Energy & Fuels. The message of Solomon et al. (2009) is that there is an irreversible climate change due to the
assimilation of CO2 in the atmosphere, solely due to anthropogenic CO2 emissions. From quantified scenarios of anthropogenic increases in atmospheric CO2, their implication is that the CO2 level flattens out asymptotically towards infinity, giving a residence time of more than 1000 years (without offering a definition or discussion of residence time or isotopic differences): “a quasi-equilibrium amount of CO2 is expected to be retained in the atmosphere by the end of the millennium that is surprisingly large: typically ~40% of the peak concentration enhancement over preindustrial values (~280 ppmv)”. The authors’ Fig. 1, i.a. shows a peak level at 1200 ppmv atmospheric CO2 in the year 2100, levelling off to an almost steady level of ~800 ppmv in the year 3000. It is not known how their 40% estimate was derived. Solomon et al. (2009) go on to say that “this can be easily understood on the basis of the observed instantaneous airborne fraction (AFpeak) of ~50% of anthropogenic carbon emissions retained during their build-up in the atmosphere, together with well-established ocean chemistry and physics that require ~20% of the emitted carbon to remain in the atmosphere on thousand-year timescales [quasiequilibrium airborne fraction (AFequil), determined largely by the Revelle factor governing the long-term partitioning of carbon between the ocean and atmosphere/biosphere system]”.
Solomon et al. (2009) have obviously not seriously considered the paper by Segalstad (1998), who addresses the 50% “missing sink” error of the IPCC and shows that the Revelle evasion “buffer” factor is ideologically defined from an assumed model (atmospheric anthropogenic CO2 increase) and an
assumed pre-industrial value for the CO2 level, in conflict with the chemical Henry’s Law governing the fast ~1:50 equilibrium partitioning of CO2 between gas (air) and fluid (ocean) at the Earth’s average surface temperature. This CO2 partitioning factor is strongly dependent on temperature because of the temperature-dependent retrograde aqueous solubility of CO2, which facilitates fast degassing of dissolved CO2 from a heated fluid phase (ocean), similar to what we experience from a heated carbonated drink.
Consequently, the IPCC’s and Solomon et al.’s (2009) non-realistic carbon cycle modelling and misconception of the way the geochemistry of CO2 works simply defy reality, and would make it impossible for breweries to make the carbonated beer or soda “pop” that many of us enjoy (Segalstad, 1998). So why is the correct estimate of the atmospheric residence time of CO2 so important? The IPCC has constructed an artificial model where they claim that the natural CO2 input/output is in static balance, and that all CO2 additions from anthropogenic carbon combustion being added to the atmospheric pool will stay there almost indefinitely. This means that with an anthropogenic atmospheric CO2 residence time of 50 - 200 years (Houghton, 1990) or near infinite (Solomon et al., 2009), there is still a 50% error (nicknamed the “missing sink") in the IPCC’s model, because the measured rise in the atmospheric CO2 level is just half of that expected from the amount of anthropogenic CO2 supplied to the atmosphere; and carbon isotope measurements invalidate the IPCC’s model (Segalstad, 1992; Segalstad, 1998).
The correct evaluation of the CO2 residence time—giving values of about 5 years for the bulk of the atmospheric CO2 molecules, as per Essenhigh’s (2009) reasoning and numerous measurements with different methods—tells us that the real world’s CO2 is part of a dynamic (i.e. non-static) system,
where about one fifth of the atmospheric CO2 pool is exchanged every year between different sources and sinks, due to relatively fast equilibria and temperature-dependent CO2 partitioning governed by the chemical Henry’s Law (Segalstad 1992; Segalstad, 1996; Segalstad, 1998).
Knowledge of the correct timing of the whereabouts of CO2 in the air is essential to a correct understanding of the way nature works and the extent of anthropogenic modulation of, or impact upon, natural processes. Concerning the Earth’s carbon cycle, the anthropogenic contribution and its influence are so small and negligible that our resources would be much better spent on other real challenges that are facing mankind.
Read more about the unwisdom of Solomon and see references here.
-------------------------
This follow-up from Leonid Klyashtorin below:
CO2 is NOT MAIN Greenhouse gas. The MAIN Greenhouse gas is Water Vapour. Its mean concentration in the Earth atmosphere is roughly 1%. and CO2 concentration is about 0.033%. CO2 increase for the last 50 yrs was about 20%(to 0.039%), i.e. TOTAL GH gases concentration rise from 1.033% to 1.039%.
The change of TOTAL Greenhouse effect of the Earth atmosphere for the last 50 years is roughly 0.6% i.e. it is on the level of statistical error. One can say that the Arctic region the most sensitive to CO2 warming effect thanks to low annual temperature caused low partial pressure of water vapor.
This year the most competent Arctic climate scientific agency, Arctic and Antarctic Research Institute (AARI) in St. Petersburg, Russia published the results of 100 year instrumental data on the Arctic temperature and sea ice area and gave its perspective forecast for the next 10-20 years. According to this forecasting the Arctic temperature will be decrease and sea ice area will be increase. As you can see from attached figure (Arctic/Global dT), age long Arctic temperature trend sharply differ from Global temperature curve. Arctic trend has not the ascending trend (i.e. Global Warming) and demonstrate
only roughly 60-year fluctuations. Here at the latest temperature maximum of 2000s do not exceed the maximun of past period Arctic warming 1920-40s (below, enlarged here).
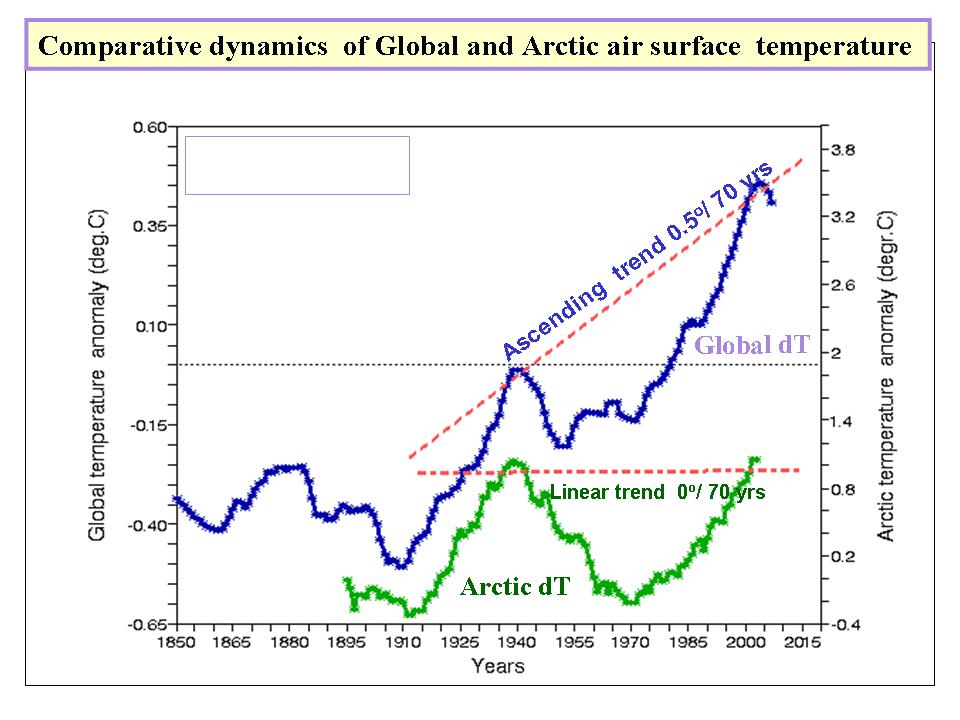

By Joseph D’Aleo
As we posted in late November, a cold pattern was shaping up for at least the first part of winter despite the El Nino, thanks to a cold PDO, and stratospheric warming (and last spring and summer’s high latitude volcanoes) which favored strong blocking.
See here how this developed in the 2005 year we used as an example in this cross section. Note the big mid tropospheric warming in late November and December with a collapse of the AO.
Enlarged here.
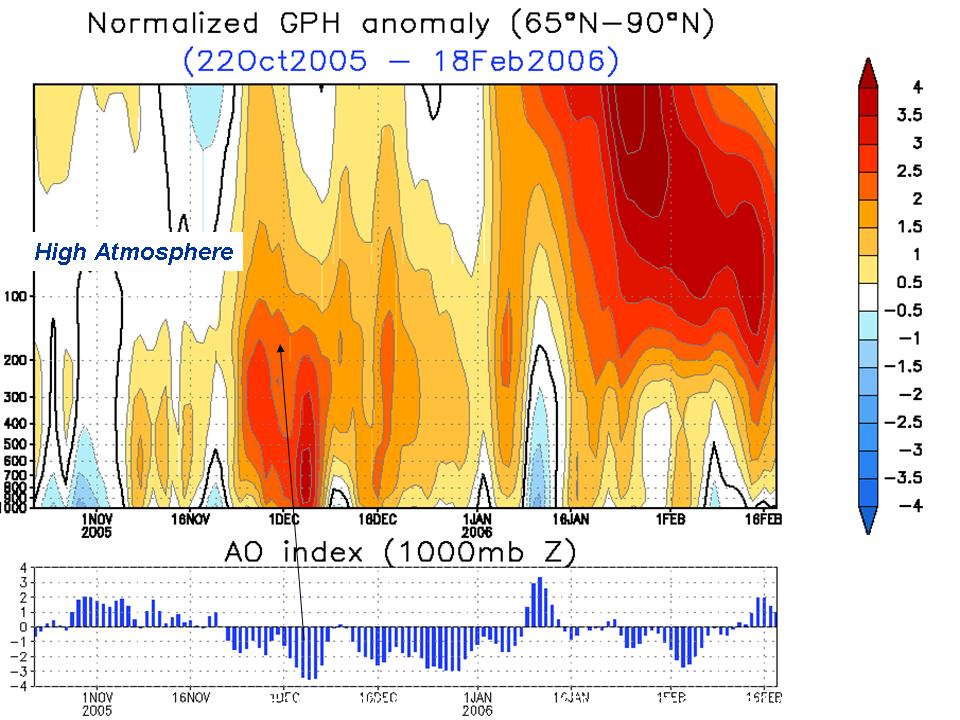
See the result in the December 1-22 period of 2005.
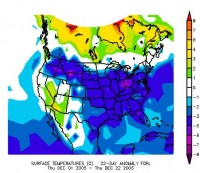
Enlarged here.
See what the polar cross-section looked like this year (below, enlarged here). See how again the AO has dropped off the chart.
Here is December 1-28th temperature anomalies (below, enlarged here).
See what the best matches for an El Nino, low solar, east QBO winter would suggest for upper levels (below, enlarged here).
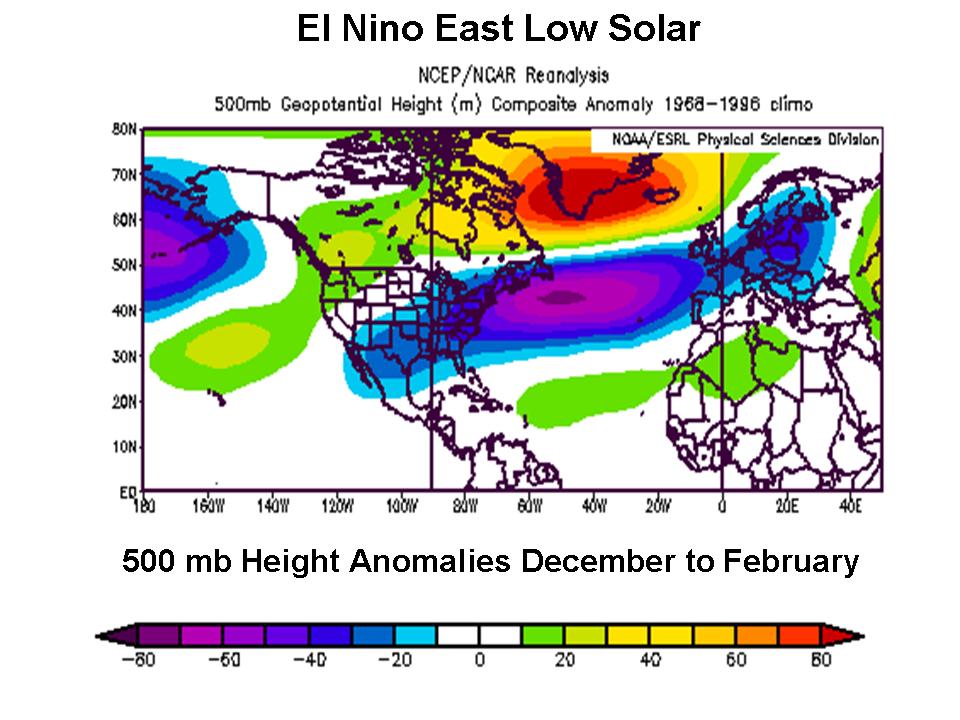

Amazingly similar to winters when the warmest waters were located in central Tropical Pacific and cold eastern areas (below and enlarged here).
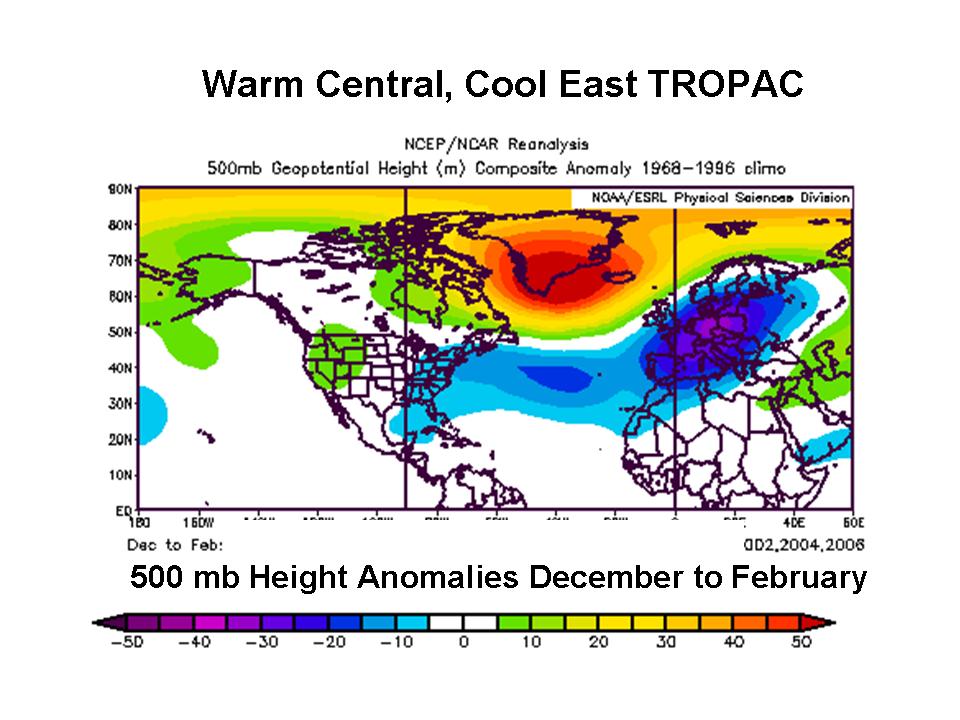
Note the tendency in both for a negative arctic oscillation (AO) and North Atlantic Oscillation (NAO) (positive heights to the north in the Atlantic and lower height south). The negative AO/NAO correlates to cold in the eastern half of the US (and western Europe) (below and enlarged here).
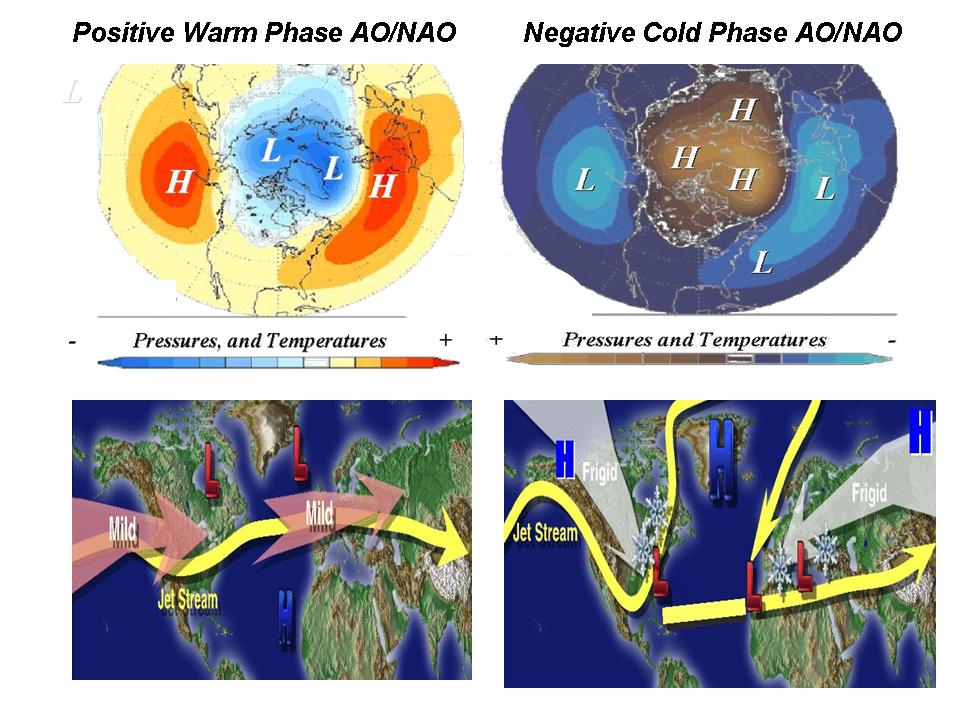
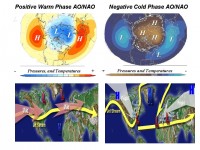
This was our ‘best match” analogs for January anomalies for the United States. No global warming here.
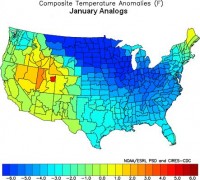
See how well temperatures in western Europe correlate with NYC temperatures (enlarged here).
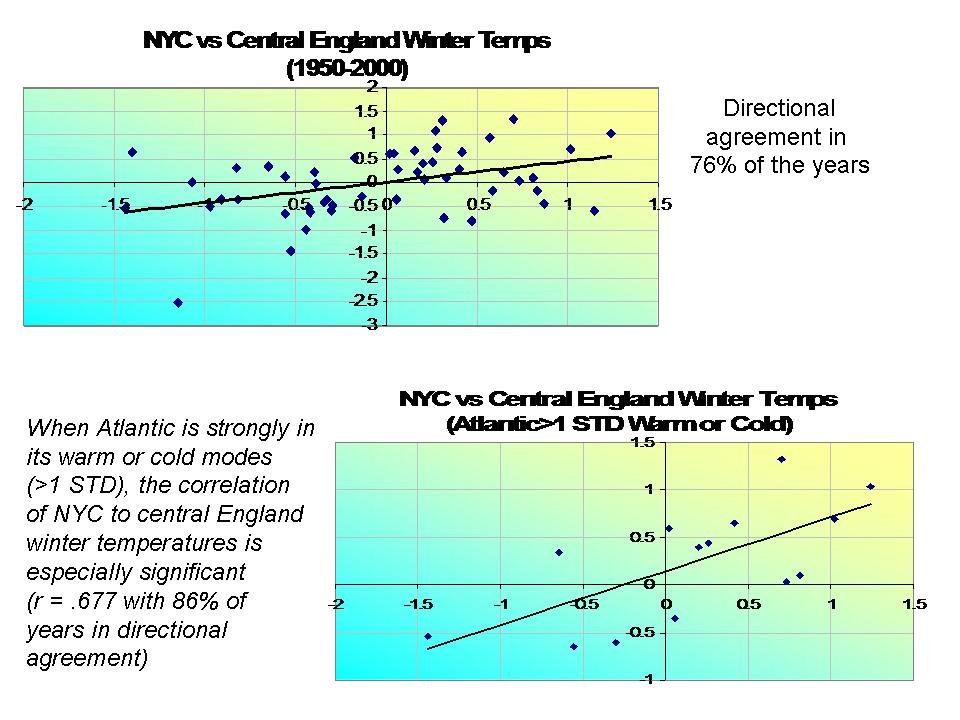

The AO reached 5.6 standard deviations negative on the 21st of December. The lowest value ever for December and behind only January 1977 and 1970 for winter values. It has backed off but still is close to 4 standard deviations negative as of today, the 30th.
See how strong the blocking is in this forecast for late this weekend (below and enlarged here).
The UKMET office got caught once again promising a warm winter and were embarrassed once again with a snowy cold late December and now are looking at more cold and snow returning across Europe next week. We have been telling our ag and energy clients in Europe and Asia and North America, this would be a cold El Nino at least well into January. Other forecasters like Accuweather’s Joe Bastardi and WeatherAction’s Piers Corbyn having been doing the same. We don’t use dynamical models for seasonal forecasts and are not biased by political correct forecasts that require focus on warmth. See also this WattsUpWithThat post with a cool visualization of the recent cold and the comments from abroad on the cold there.
After some weekend snowfall (welcome as protection for winter wheat), China which has had very cold conditions will see another Siberian blast this week, with temperatures approaching the all-time record low of -9F for Beijing.
2009 RANKED 5th IN SUNSPOTLESS DAYS SINCE 1849
Right behin 2008. 260 spotless days compared to 265 in 2008 (below and enlarged here).
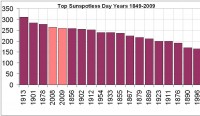
Sunspots in December increased after a quiet first 8 days. Solar maximum is expected around 2013 with most forecasters expecting a low max (40 to 90 sunspot number). The similarities to the cycles in the late 1700s and early 1800s has many talking a Dalton Minimum, the time of Dickens and snowy London town. Hmmmm (below and enlarged here).
See Intellicast view of this here.